Understanding SPE Breakthrough: The Critical Phenomenon in Solid-Phase Extraction
Solid-phase extraction (SPE) breakthrough represents one of the most significant challenges in analytical sample preparation, directly impacting method accuracy, precision, and overall analytical performance. As product manager at Poseidon Scientific, I’ve witnessed how breakthrough issues can compromise entire analytical workflows, leading to false negatives, inaccurate quantitation, and wasted resources. This comprehensive guide explores the fundamental mechanisms behind SPE breakthrough and provides practical strategies for prevention.
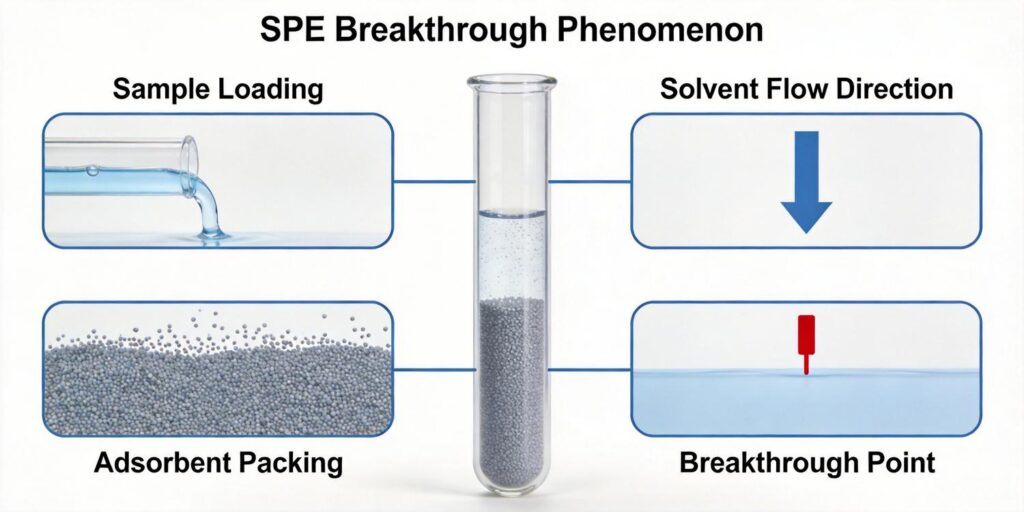
1. Definition of Breakthrough: The Fundamental Concept
Breakthrough in SPE refers to the ineffective retention of target analytes on the solid-phase sorbent, resulting in low analyte recovery. During sample application, breakthrough occurs when analytes pass through the sorbent bed unretained, essentially bypassing the extraction mechanism entirely. According to Larrivee and Poole (1994), breakthrough volume is defined as “the volume of sample, assumed to have a constant concentration, that can be passed through the SPE device before the concentration of the analyte at the outlet of the device reaches a certain fraction of the concentration of the analyte at the inlet.”
The breakthrough curve, a fundamental concept in frontal chromatography, illustrates this phenomenon graphically. As shown in Figure 1 from Poole and Poole’s work, the curve is bilogarithmic with an inflection point corresponding to the retention volume (Vr). The breakthrough volume (Vb) is typically defined as the volume at which 1% of the analyte concentration is detected at the outlet, while V99 represents the point where 99% breakthrough occurs. This 1% threshold is chosen to minimize breakthrough losses while maintaining practical detection limits.
Several factors contribute to breakthrough beyond simple capacity limitations:
- Improper conditioning of the sorbent bed
- Inappropriate loading solvent composition (ionic strength, organic strength)
- Insufficient diffusion and mass transfer due to inadequate residence time
- Volume overload where weakly retained analytes migrate with the matrix
- Mass overload where capacity is insufficient for analyte or matrix components
- Incorrect sorbent selection for the target analyte chemistry
2. Capacity Limitations: Understanding Sorbent Loading Boundaries
Capacity represents the ability of the sorbent to retain a given compound under specific solvent conditions. This parameter is fundamentally related to both the analyte properties and the matrix environment. The capacity of an SPE device depends on several key factors:
2.1 Theoretical Capacity Relationships
The Lovkvist and Jonsson equations (1987) provide a mathematical framework for understanding breakthrough volumes in relation to sorbent characteristics:
Vb = (a + b/N + c/N2)-1 (1 + k’)V0
Where:
• Vb = breakthrough volume
• N = plate number for the sorbent bed
• k’ = capacity factor for the analyte
• V0 = interparticle volume
• a, b, c = constants
This relationship demonstrates that larger breakthrough volumes are achieved when both k’ and V0 are large. Essentially, compounds must be strongly retained in a device with sufficient volume. Higher N values also correspond to larger Vb, though SPE devices generally have lower efficiencies due to larger particles and shorter bed lengths.
2.2 Practical Capacity Considerations
In practical applications, capacity is rarely approached under ideal conditions. Real samples contain matrix components that compete for sorbent binding sites, effectively reducing available capacity for target analytes. As noted in the literature, “for compounds with a capacity factor of less than 10 on the SPE device, pre-concentration is hardly feasible.”
The relationship between sorbent mass and capacity becomes particularly important when comparing different SPE formats. Consider this comparison from Simpson’s work:
- A conventional 3 mL syringe barrel typically contains 500 mg of sorbent with bed dimensions of 15 mm depth and 12 mm diameter
- A typical SPE disc in the same barrel contains approximately 35 mg of sorbent in a bed that is 12 mm in diameter but only 1 mm deep
Assuming a specific breakthrough capacity of 5% analyte per gram of sorbent, the conventional bed offers 25 mg capacity while the disc provides 1.75 mg capacity. Both values are generally adequate for most analytical applications, but understanding these differences is crucial for method development.
2.3 Calculating Practical Capacity
To determine your analyte’s capacity on a specific sorbent:
- Prepare appropriate dilutions of your compound in distilled water
- Condition your extraction column with appropriate solvent
- Add incremental sample volumes and analyze effluent to determine breakthrough point
- Calculate specific capacity (Csp)
- Evaluate whether conditions are appropriate for your extraction needs
As demonstrated in a practical example with Azure A blue dye, capacity calculations follow this formula:
Csp = (mg of dye retained) / (g of packing material)
This yields a percentage capacity that indicates how much analyte the sorbent can theoretically retain under ideal conditions.
3. Flow Rate Effects: The Kinetic Dimension of Breakthrough
Flow rate represents one of the most critical operational parameters affecting breakthrough. As noted in forensic applications literature, “the most common cause of breakthrough is flow rates that exceed the sorbent affinity for binding of target compounds. This results from inadequate mass transfer of the analyte to sorbent binding sites.”
3.1 Linear Velocity vs. Flow Rate
The important kinetic parameter in SPE breakthrough is linear velocity rather than absolute flow rate. High linear velocities may result in premature breakthrough, but flow rates can be increased while keeping linear velocities low by increasing the cross-sectional area of the packed bed. This principle explains why 47 mm disc-shaped sorbent beds can process large volumes at flow rates up to 200 mL per minute without breakthrough—their linear velocities remain moderate at approximately 1.7 mm per second.
3.2 Theoretical Plate Considerations
SPE devices typically have low theoretical plate numbers (N values), often between 4 and 20 plates. When N < 4, premature breakthrough occurs for kinetic reasons—molecules travel through and exit the device faster than they can be adsorbed, regardless of the device's capacity. This problem can be mitigated by reducing sample application flow rates. In the limiting case, maximum sorbent capacity could be realized if the flow rate approached zero.
The Lovkvist and Jonsson model predicts that for well-retained analytes, breakthrough volumes can be large despite sampling devices having very low numbers of theoretical plates. However, research by Mol et al. (1995) demonstrated that when N < 1.5, breakthrough volume cannot be increased by increasing retention, indicating a minimum efficiency threshold for quantitative trapping.
3.3 Flow Rate Optimization Strategies
Different SPE formats exhibit varying flow rate characteristics:
| Product (Particle Diameter) | Flow Rate Range (mL/min) | Specific Permeability (10-14 m2) |
|---|---|---|
| Empore Disk (10 μm) | 100-240 | 3 |
| ENVI Disk (15 μm) | 101-250 | 8 |
| Speedisk (10 μm) | 100-240 | 12 |
Ion exchange extractions are generally more sensitive to flow rate variations than polar or non-polar extractions. The load and elute steps typically show the greatest sensitivity to flow rate changes. When using vacuum systems, pressure remains constant while flow rate varies based on sample viscosity and sorbent characteristics. Positive pressure systems, particularly those using pumps or syringes, provide more stable flow control.
4. Bed Mass Selection: Strategic Sorbent Quantity Optimization
Bed mass selection represents a critical balance between sufficient capacity and practical considerations including cost, solvent usage, and processing time. Unlike HPLC where column length increases resolution, SPE operates on stop-and-go chromatography principles where capacity remains constant regardless of bed geometry for a given sorbent mass.
4.1 Bed Geometry Considerations
The relationship between bed dimensions and performance follows several key principles:
- Cross-sectional area determines flow characteristics: A 100 mg bed in a 6-mL tube offers the same capacity as 100 mg in a 1-mL tube but provides better flow due to increased cross-sectional area and reduced bed height
- Bed stability affects reproducibility: Conventional packed beds with large particle sizes (40-60 μm) may channel because particles are held in essentially fluidizable beds. Disc formats with smaller particles (10-30 μm) held in fibrous meshes show minimal channeling
- Specific permeability varies by format: Standard cartridges typically have specific permeability around 25 × 10-14 m2, while discs range from 3-12 × 10-14 m2
4.2 Selecting Appropriate Bed Mass
When determining optimal bed mass for your application:
- Calculate theoretical requirements: Based on analyte concentration and sample volume
- Consider matrix effects: Real samples contain competing compounds that reduce available capacity
- Evaluate flow requirements: Higher bed masses generally allow faster processing but increase cost
- Balance capacity with practicality: Excess packing increases product cost and solvent usage without necessarily improving performance
Typical bed sizes range from 50 mg to 10 grams, with 200-500 mg being most common for analytical applications. For large volume environmental samples, column formats often prove more cost-effective, while laboratories with existing filtration apparatus may prefer disc formats.
4.3 Preventing Breakthrough Through Proper Bed Mass Selection
To prevent breakthrough through strategic bed mass selection:
- Always include a safety margin: Select bed mass 2-3 times greater than calculated minimum requirements
- Consider sample characteristics Particulate-laden samples may require pre-filtration or larger bed masses to prevent clogging
- Evaluate elution volume requirements: Larger bed masses typically require larger elution volumes, potentially diluting your final extract
- Test with real matrices: Capacity determined with pure standards often overestimates performance with real samples
Practical Recommendations for Breakthrough Prevention
Based on extensive literature review and practical experience, here are key recommendations for preventing SPE breakthrough:
- Always condition sorbents properly to ensure complete activation of binding sites
- Optimize flow rates based on sorbent type and analyte characteristics, with particular attention to loading steps
- Select appropriate bed mass with adequate safety margins for matrix effects
- Validate methods with real samples rather than relying solely on pure standard data
- Monitor breakthrough curves when developing new methods or working with unfamiliar matrices
- Consider disc formats for high-flow applications where linear velocity control is critical
- Implement quality control checks for each new lot of SPE material
At Poseidon Scientific, our HLB SPE cartridges, MAX SPE cartridges, MCX SPE cartridges, and 96-well SPE plates are engineered with these breakthrough considerations in mind. Each product undergoes rigorous testing to ensure consistent performance across lots and applications.
Understanding SPE breakthrough requires appreciation of both thermodynamic (capacity) and kinetic (flow rate) factors. By applying the principles outlined here—properly defining breakthrough parameters, respecting capacity limitations, optimizing flow rates, and selecting appropriate bed masses—analysts can develop robust SPE methods that deliver consistent, reliable results. Remember that breakthrough prevention isn’t just about avoiding analyte loss; it’s about ensuring the accuracy and precision that form the foundation of reliable analytical chemistry.