What is Breakthrough Volume in SPE?
Breakthrough volume (Vb) is a fundamental concept in solid-phase extraction (SPE) that defines the maximum sample volume that can be processed through an SPE device before analyte loss occurs. According to Larrivee and Poole (1994), breakthrough volume is defined as “the volume of sample, assumed to have a constant concentration, that can be passed through the SPE device before the concentration of the analyte at the outlet of the device reaches a certain fraction of the concentration of the analyte at the inlet.”
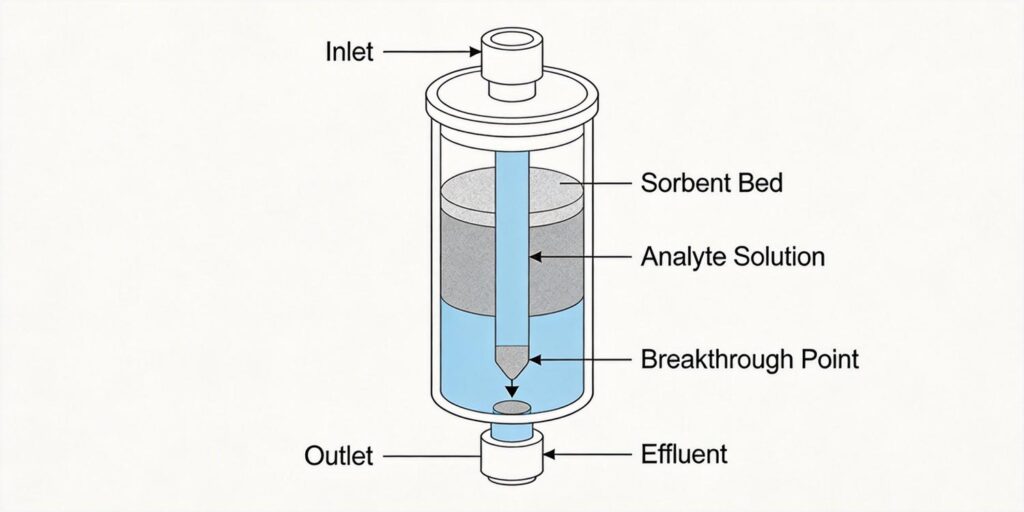
In practical terms, when the sample volume exceeds the breakthrough volume, analytes begin to appear in the effluent, leading to reduced recovery. The breakthrough curve (Figure 1) illustrates this phenomenon, showing the relationship between sample volume and analyte concentration in the effluent. Typically, Vb is defined as the point where the effluent concentration reaches 1% of the inlet concentration, though some applications may use 5% or other thresholds depending on sensitivity requirements.
The Breakthrough Curve Explained
The breakthrough curve has three key points:
- Breakthrough Volume (Vb): Where effluent concentration reaches 1% of inlet concentration
- Retention Volume (Vr): The inflection point of the curve, corresponding to the chromatographic retention volume
- Maximum Sampling Volume (Vm): Where effluent concentration reaches 99% of inlet concentration
For trace analysis, Vb is the most critical parameter since it represents the largest sample volume that can be processed without significant analyte loss, ensuring 100% recovery (in the absence of irreversible sorbent interactions).
Factors Affecting Retention and Breakthrough
1. Analyte-Sorbent Interaction Strength
The primary factor determining breakthrough volume is the strength of interaction between the analyte and sorbent. Poole’s research group has demonstrated that breakthrough volumes can be predicted by examining solvation parameters that characterize analyte retention. Solute size is identified as a primary driving force for sorbent retention under SPE conditions, with polar interactions favoring retention in the aqueous mobile phase and decreasing breakthrough volume.
2. Capacity Factor (k’)
The capacity factor is directly related to breakthrough volume through the equation:
Vb = V0(1 + k’)
Where V0 is the interparticle volume. Bidlingmeyer (1984) demonstrated that for compounds with capacity factors of 10 and 30, breakthrough volumes would be approximately 11 and 31 column volumes respectively (assuming a 1.0 mL column volume). For compounds with k’ values less than 10, preconcentration via SPE becomes challenging.
3. Sorbent Bed Efficiency (N)
The number of theoretical plates (N) significantly impacts breakthrough volume. According to the Lovkvist and Jonsson equations:
Vb = (a + b/√N + c/N2)-1/2(1 + k’)V0
Where a, b, and c are constants. Higher N values correspond to larger breakthrough volumes. However, SPE devices typically have low N values (often N < 4) due to large particles and short bed lengths, leading to premature breakthrough for kinetic reasons.
4. Flow Rate and Linear Velocity
Breakthrough volume shows significant flow-rate dependence, particularly when sample volume exceeds Vb. High linear velocities can result in premature breakthrough because molecules travel through the device faster than they can be adsorbed. This kinetic limitation can be mitigated by reducing flow rates or increasing the cross-sectional area of the packed bed.
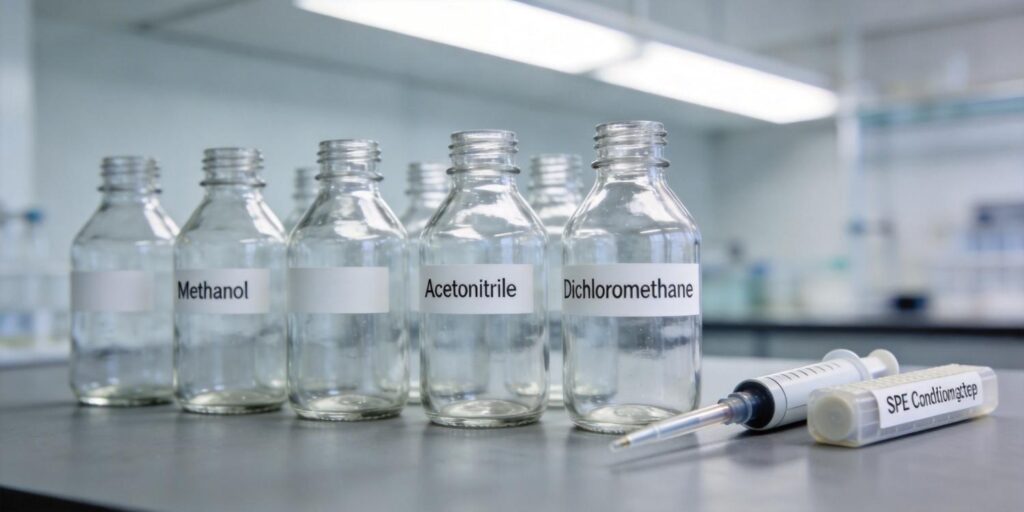
5. Organic Modifiers
The presence of organic modifiers in the sample can dramatically affect breakthrough volumes. Poole and Poole (1995) found that adding just 1% (v/v) of organic modifiers like methanol, propan-1-ol, tetrahydrofuran, or acetonitrile can change breakthrough volumes by up to an order of magnitude. This occurs because the selective sorption of organic solvent by the sorbent changes the stationary-phase volume and system selectivity.
6. Sample Matrix Effects
Real samples contain matrix components that compete with analytes for sorbent sites. Proteins in biological samples and humic matter in environmental samples, even when present at low concentrations relative to the analyte, can significantly reduce breakthrough volumes through competitive adsorption.
Cartridge Capacity Considerations
Understanding Sorbent Capacity
Cartridge capacity refers to the ability of the sorbent to retain a given compound under specific conditions. For silica-based sorbents, typical capacity values range between 5-50 mg per gram of sorbent, with polymeric SPE packings offering somewhat higher values. However, these are theoretical maximums that are rarely achieved in practice due to matrix effects and kinetic limitations.
Bed Mass Selection
The general rule of thumb for cartridge selection is that the amount of analyte should be no more than about 5% of the sorbent weight. However, this is an extreme approximation that must be validated for each application. Cartridges are available with sorbent bed masses ranging from 10 mg to 10 g or more, with selection based on:
- Expected analyte mass
- Matrix complexity and competing components
- Required sample volume
- Desired concentration factor
Capacity vs. Recovery
It’s crucial to differentiate between capacity and recovery. Capacity is the amount of analyte a packed bed can retain from a sample matrix, while recovery is the actual amount retained and retrieved. The optimal situation uses the smallest amount of sorbent that provides adequate capacity, balancing cost and solvent usage against performance requirements.
Breakthrough Monitoring
For analyses requiring high microgram or low milligram quantities, or when working with weakly retained species, using an additional column in series with the primary SPE column is recommended to monitor for breakthrough. If analyte appears in the eluent of the second cartridge after sample loading and separate elution of each cartridge, the sorbent capacity of the first cartridge has clearly been exceeded.
Method Optimization Examples
Example 1: Environmental Water Analysis
For analyzing polar compounds in water samples, Liska et al. (1990) measured breakthrough curves to calculate theoretical preconcentration factors. They found that for reversed-phase SPE, appropriate sample volumes could be approximated using log Pow values (logarithm of the n-octanol/water partition coefficient). Chemicals with log Pow values above approximately 3.5 showed no breakthrough from alkyl-bonded silica sorbents up to sample volumes of one liter.
Example 2: Pharmaceutical Analysis
In clinical and pharmaceutical applications where sample volumes are limited, reduced solvent volume (RSV) columns offer significant advantages. These columns provide:
- 75% reduction in total liquid volumes
- 50% reduction in eluate volume
- Superior flow characteristics with less flow restriction
- High capacity with greater linear range
For compounds like barbiturates, benzoylecgonine, THC-COOH, and phencyclidine, RSV columns achieved 70-76% solvent reduction compared to traditional packed columns, with no analyte breakthrough at 1000 ng/mL and less than 0.2% breakthrough at higher concentrations.
Example 3: Forensic Applications
In forensic analysis, checking analyte capacity is critical. The recommended procedure involves:
- Preparing appropriate dilutions of the compound in distilled water
- Conditioning the extraction column with appropriate solvent
- Adding increments of sample compounds and analyzing to determine breakthrough concentration
- Calculating the specific capacity (Csp)
- Deciding if conditions are appropriate for the extraction
For example, with Azure A blue dye on C18 sorbent, capacity calculations showed 20 mg of dye per gram of C18, representing 2% capacity (100 mg of packing can hold up to 2 mg of analyte under ideal conditions).
Example 4: Method Development Strategy
Hughes and Gunton (1995) applied a model based on liquid-liquid extraction theory to interpret elution profiles for multi-component SPE data. Rather than using traditional recovery versus volume plots, they plotted extraction profiles as functions of [-ln(1-RT)] where RT is the total extraction recovery, versus volume V. This approach allows improved differentiation between various SPE schemes and reveals the effects of sample loading mass more clearly.
Practical Recommendations for Breakthrough Optimization
1. Determine Breakthrough Volumes Experimentally
While theoretical models exist, the most reliable approach is to determine breakthrough volumes experimentally for your specific analytes and matrix. Use a second cartridge in series during method development to monitor breakthrough.
2. Optimize Flow Rates
Reduce flow rates to minimize kinetic limitations, especially when working with large sample volumes. For disc-shaped sorbent beds, moderate linear velocities (around 1.7 mm per second) allow processing of large volumes at flow rates up to 200 mL per minute without breakthrough.
3. Consider Sorbent Alternatives
If breakthrough occurs too quickly with your current sorbent:
- Increase bed size to increase total capacity
- Change from monomeric to polymeric phases for higher loading
- Switch to different retention mechanisms (ion exchange, normal phase)
- Use coupled columns to filter out interfering matrix components
4. Monitor Matrix Effects
Always validate breakthrough volumes in matrices similar to your actual samples. Competitive adsorption from matrix components can significantly reduce effective capacity.
5. Use Predictive Tools
For initial method development, use log Pow values and solvation parameter models to estimate breakthrough volumes. These tools can guide sorbent selection and sample volume decisions before experimental verification.
Conclusion
Understanding breakthrough volume is essential for developing robust SPE methods that maximize concentration factors while maintaining high recovery. By considering the factors that affect retention—analyte-sorbent interaction strength, capacity factor, sorbent bed efficiency, flow rate, organic modifiers, and matrix effects—analysts can optimize their SPE protocols for specific applications.
Remember that SPE has evolved into a predictive science where 90% absolute recovery should be achievable with proper optimization. If you’re not achieving this level of performance, your method likely needs refinement. At Poseidon Scientific, our HLB SPE cartridges, MAX SPE cartridges, MCX SPE cartridges, WAX SPE cartridges, WCX SPE cartridges, and 96-well SPE plates are designed to provide consistent performance with well-characterized breakthrough properties for your most challenging applications.