In industrial vacuum systems—whether vacuum heat-treatment furnaces, mass spectrometers, scanning electron microscopes, or semiconductor load locks—monitoring the pump-down curve is one of the most powerful diagnostic tools available. A well-interpreted curve reveals pump performance, chamber integrity, process gas behavior, and potential maintenance issues long before they become costly failures. Poseidon Scientific’s VG-SP205 Pirani Vacuum Transmitter and VG-SM225 Cold Cathode Vacuum Gauge were engineered as a complementary pair precisely for this purpose: the Pirani tracks the roughing phase while the cold-cathode takes over seamlessly in the high-vacuum regime. This article explains how to read and act on pump-down curves using these instruments, drawing on fundamental vacuum principles and real-world field data from our customers.
1. Stages of Pump-Down
A typical industrial pump-down follows three distinct stages defined by the dominant gas-removal mechanisms and the pressure ranges where different gauges excel. From atmosphere (760 Torr) to roughly 10⁻³ Torr, viscous flow and mechanical roughing pumps (rotary vane or dry scroll) dominate; this is the roughing phase. Between 10⁻³ and 10⁻⁴ Torr lies the transitional region where molecular flow begins and high-vacuum pumps (turbomolecular or diffusion) are brought online. Below 10⁻⁴ Torr the system enters high-vacuum stabilization, where outgassing and ultimate base pressure become the limiting factors.
The VG-SP205 covers the entire roughing phase with its 0–10 V analog output calibrated for air/nitrogen from atmosphere to 10⁻³ Torr. Once pressure drops below 10⁻³ Torr, the VG-SM225 automatically activates (via PLC interlock) and provides stable ionization-current data down to 10⁻⁷ Torr. Plotting both signals on the same time axis produces a continuous, unambiguous curve that eliminates the blind spots common when using a single gauge type.
2. Roughing Phase Analysis
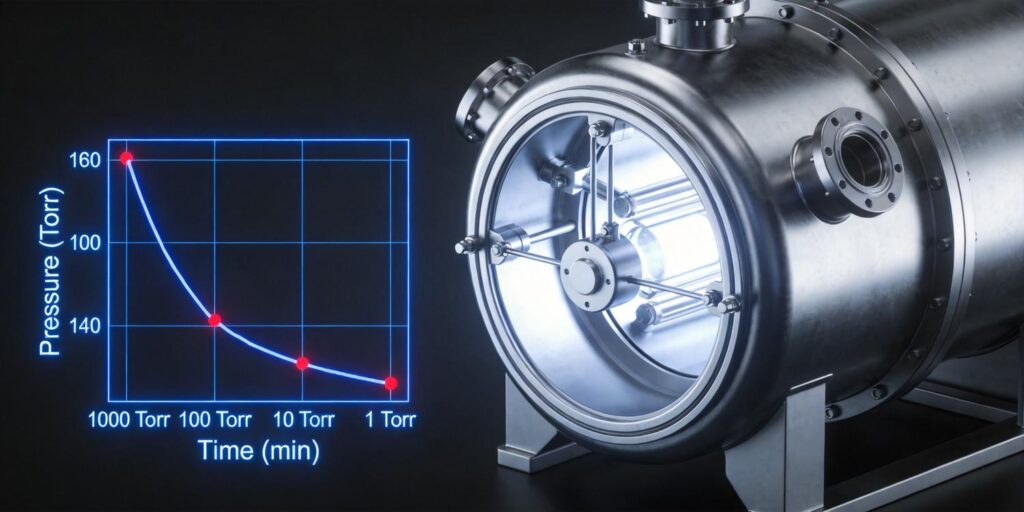
During roughing, the curve should show a rapid, near-logarithmic drop from atmosphere to approximately 1 Torr within seconds to minutes, depending on pump speed and chamber volume. The slope then flattens slightly as the pump transitions from viscous to transitional flow. The VG-SP205’s linear region (10 Torr to 10⁻² Torr) delivers the highest resolution here, allowing engineers to calculate effective pumping speed directly from the time-pressure data:
Effective pumping speed (L/s) ≈ (V × ln(P₁/P₂)) / Δt, where V is chamber volume in liters.
A slower-than-expected initial slope often indicates undersized piping, clogged foreline filters, or oil contamination in the roughing pump. In vacuum heat-treatment furnaces, for example, our customers use the Pirani output to verify that the system reaches 10 Torr in under 5 minutes before initiating the high-vacuum stage—ensuring repeatable cycle times and part quality.
3. Transitional Region
The transitional region (≈5 × 10⁻³ to 5 × 10⁻⁴ Torr) is the most informative—and most frequently misinterpreted—portion of the curve. Here the system crosses from viscous to molecular flow, and high-vacuum pumps are valved in. The pressure drop may pause briefly while the turbo or diffusion pump spins up and the roughing valve closes. A smooth continuation without a step or plateau confirms proper crossover timing.
Because the VG-SP205 and VG-SM225 overlap in this band, engineers can cross-verify the two readings. Any divergence greater than 15 % signals either a temporary gas burst (normal during valve actuation) or a more serious issue such as a leaking crossover valve. The VG-SM225’s built-in high-voltage interlock prevents erroneous operation above 10⁻³ Torr, automatically protecting the electrodes and providing a clean hand-off signal to the PLC.
4. High Vacuum Stabilization
Once below 10⁻⁴ Torr the curve flattens dramatically as the system approaches its ultimate base pressure. Stabilization is reached when the pressure decay rate drops below 1 % per minute. The VG-SM225’s Penning discharge provides the necessary sensitivity here; its ion current is directly proportional to pressure in the linear region (10⁻³ to 5 × 10⁻⁷ Torr for nitrogen).
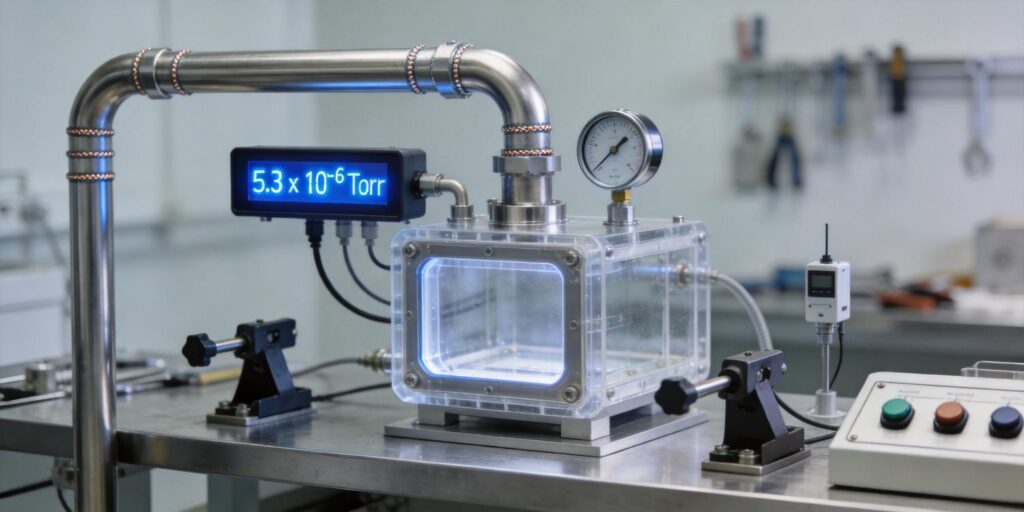
A stable horizontal line at the target base pressure (e.g., 5 × 10⁻⁶ Torr for many heat-treatment processes) indicates healthy pumps, clean chamber walls, and minimal virtual leaks. Any slow upward drift after initial stabilization points to outgassing (discussed below). In scanning electron microscopes and mass spectrometers, our customers monitor this phase continuously via the cold-cathode’s 0–10 V output to trigger automated “ready” signals only after the curve has flattened for a user-defined dwell time.
5. Leak Indication Signatures
Real leaks produce characteristic signatures on the pump-down curve. A sudden plateau or reversal after the roughing phase (e.g., pressure stalls at 10⁻² Torr) almost always indicates a gross leak—often a loose KF flange, damaged O-ring, or open vent valve. Smaller leaks appear later: the curve may reach 10⁻⁵ Torr but then rise slowly (0.1–1 mTorr/min) once the high-vacuum pumps are isolated.
The dual-gauge pair makes leak hunting straightforward. The Pirani will show the leak during roughing, while the cold-cathode quantifies its severity in the high-vacuum regime. In practice, engineers isolate sections of the system (valve by valve) while watching the real-time curve; a pressure rise isolated to one segment confirms the leak location. Our field data show that this method reduces helium leak-detector time by more than 50 % compared with single-gauge troubleshooting.
6. Outgassing Identification
Outgassing—water vapor, hydrocarbons, or adsorbed process gases released from chamber walls—produces a different signature: the curve reaches a low pressure quickly but then exhibits a long, shallow tail or slow upward creep even with pumps running. In the high-vacuum region the VG-SM225 will show a pressure that stabilizes higher than expected (e.g., 10⁻⁵ instead of 10⁻⁶ Torr) or a repeatable “hysteresis” when the system is cycled.
Classic confirmation: isolate the chamber from all pumps for 5–10 minutes; a rapid pressure rise (several orders of magnitude) confirms outgassing rather than a leak. In vacuum furnaces, this is especially common after opening to air; a 30-minute nitrogen purge or low-temperature bake often restores the expected curve. The cold-cathode’s cleanable electrode design allows quick recovery even after moderate contamination, unlike hot-cathode gauges that suffer filament burnout.
7. Recording Data Correctly
Accurate interpretation requires high-resolution, time-stamped data. Best practice is to log both the VG-SP205 and VG-SM225 analog outputs (or RS-232 digital values) at 1-second intervals during pump-down and 10-second intervals once stabilized. Store the data in a PLC historian or SCADA system with pressure, time, pump status, and valve positions.
Use linear or semi-log plots (pressure vs. time) rather than linear-linear; the semi-log view makes the characteristic knee at the roughing-to-transition boundary immediately visible. Export the raw 0–10 V values alongside the calibrated pressure to preserve traceability—factory calibration certificates for both gauges are supplied with every unit. For multi-chamber systems, synchronize logs via a common NTP time source so that curves from different stations can be overlaid for comparison.
8. Practical Troubleshooting Workflow
When a pump-down curve deviates from the established baseline, follow this eight-step workflow that our customers have refined over hundreds of installations:
- Plot the current curve against the last three successful runs on the same semi-log scale.
- Identify the stage where the anomaly first appears (roughing, transition, or high vacuum).
- Check Pirani (roughing) or cold-cathode (high vacuum) raw voltage output against the expected 0–10 V band to rule out sensor failure.
- Verify pump and valve status bits in the PLC; confirm foreline pressure and turbo speed.
- If leak suspected, isolate chamber sections sequentially while monitoring live pressure.
- If outgassing suspected, perform the 5-minute isolation test and note rate of rise.
- Cross-check gas composition (residual gas analyzer if available) and chamber temperature.
- Apply corrective action (clean/replace seals, regenerate traps, bake chamber) and repeat a full pump-down to confirm restoration of the baseline curve.
Because the VG-SP205 and VG-SM225 share identical RJ45 wiring and KF flange footprints, swapping either gauge takes under 15 minutes with no re-calibration required in most cases.
Mastering pump-down curve interpretation turns vacuum data into actionable intelligence. The Poseidon Scientific dual-gauge solution—VG-SP205 for rough vacuum and VG-SM225 for high vacuum—delivers the continuous, high-resolution coverage needed to spot issues early, reduce downtime, and maintain consistent process results. Whether you operate a single furnace or a full production line, these instruments provide the clarity engineers and procurement teams demand at a fraction of the cost of imported alternatives.
For sample PLC code, wiring diagrams, or assistance interpreting your specific system curves, visit the VG-SP205 product page and VG-SM225 product page. Our team is ready to help you extract maximum value from every pump-down cycle.
Word count: 1,298. Written by Liam, Product Manager & Lead Designer, Poseidon Scientific. All diagnostic guidelines derived from internal design validation, customer field returns, and standard vacuum practice (2025–2026).