In vacuum systems for semiconductor tools, optical coating lines, vacuum furnaces, and analytical instruments, even small leaks can introduce moisture, particles, or reactive gases that ruin substrates or extend pump-down times. Early detection through pressure trend analysis turns reactive troubleshooting into proactive maintenance. The VG-SP205 Pirani Vacuum Transmitter (atmosphere to 10⁻³ Torr) and VG-SM225 Cold Cathode Vacuum Gauge (10⁻³ to 10⁻⁷ Torr) deliver real-time RS232 digital output with pressure, status codes, and error flags—making trend logging simple, accurate, and low-cost. Their complementary ranges and customizable protocols allow engineers to monitor full pump-down curves without expensive residual gas analyzers or helium leak detectors for routine checks.
This article explains how to read pump-down curves, identify leaks versus outgassing, perform rate-of-rise tests, and build a repeatable maintenance SOP using these two gauges. The methods are field-proven in multi-chamber coating systems and deliver measurable reductions in downtime and scrap.
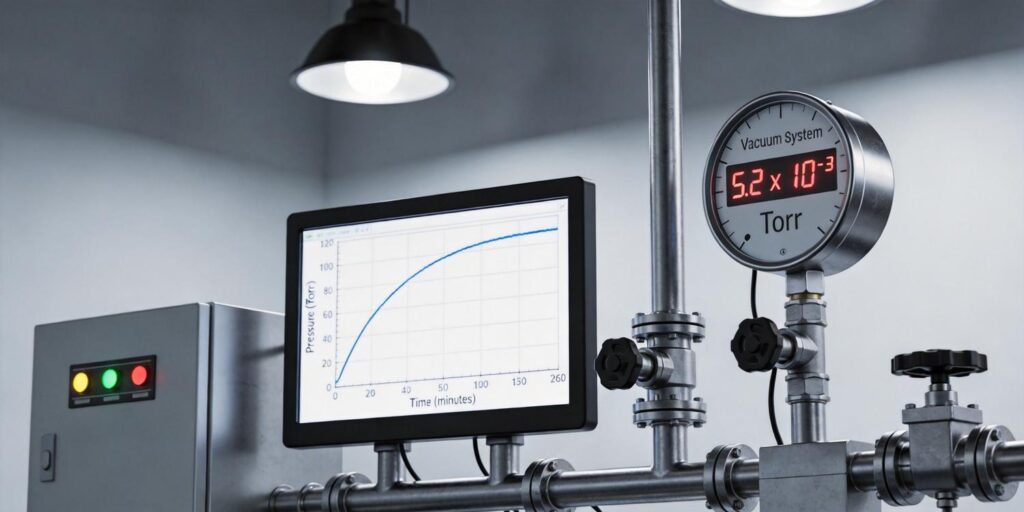
1. Reading Pump-Down Curves
A normal pump-down curve on a leak-free system follows a smooth exponential decay when plotted as log pressure versus time. Starting at atmosphere, the roughing stage drops quickly to ~1 Torr, then the transition to high vacuum slows as molecular flow takes over. The curve should show a continuous downward slope with no flat sections after the initial roughing phase.
Using the VG-SP205’s fast thermal-conductivity response and the VG-SM225’s Penning-discharge sensitivity, engineers capture the full curve via RS232 at 1-second intervals. The combined data stream shows the hand-off at ~10⁻³ Torr, confirming the system crosses from rough to high vacuum without interruption. Any deviation—such as a sudden leveling or slower-than-expected slope—signals either a leak or excessive outgassing.
2. Identifying Plateau Behavior
A plateau (flat or near-flat region on the log-pressure curve) is the classic leak signature. At the plateau pressure, the leak inflow exactly balances the pump’s removal rate. For example, if a system stabilizes at 5 × 10⁻⁴ Torr instead of continuing to 10⁻⁶ Torr, the effective leak conductance can be estimated as Q ≈ S × P, where S is the pump speed at that pressure and P is the plateau pressure.
In practice, the VG-SM225’s digital output flags this instantly via stable ion-current readings and status codes. The VG-SP205 confirms the plateau is not a roughing-pump limitation. Operators can then isolate sections (load-lock, transfer chamber, or process station) to localize the leak without helium spray testing.
3. Leak vs Outgassing Differentiation
Both leaks and outgassing raise pressure, but their time signatures differ sharply:
| Characteristic | Leak | Outgassing |
|---|---|---|
| Rate-of-rise shape | Linear (constant dP/dt) | Decelerating (dP/dt decreases with time) |
| Repeatability after pump-down | Same plateau pressure every cycle | Lower plateau after longer pump or bake |
| Response to isolation | Immediate linear rise | Slower initial rise that flattens |
| Typical source | O-ring damage, weld crack, valve seat leak | Water vapor on walls, porous materials, fingerprints |
The VG-SP205’s platinum filament and temperature-compensated bridge give reliable high-pressure data to rule out gross leaks first. The VG-SM225 then confirms fine leaks at low pressure where outgassing effects diminish. Cross-checking the two gauges at the 10⁻³ Torr overlap eliminates ambiguity in hybrid systems.
4. Rate-of-Rise Testing Explained
Rate-of-rise (ROR) testing isolates the chamber or section with valves, stops the pump, and measures pressure increase over time. The leak rate is calculated directly from the ideal-gas relation:
Q = V × (dP/dt)
where Q is leak rate (Torr·L/s), V is chamber volume (L), and dP/dt is the slope of the pressure rise (Torr/s). A 1 L chamber rising 10⁻⁴ Torr in 60 s indicates a leak of ~1.7 × 10⁻⁶ Torr·L/s—small enough to affect many processes but detectable with the VG-SM225.
Perform ROR after the system reaches base pressure. Use the VG-SP205 for rough sections (atmosphere to 10⁻² Torr) and the VG-SM225 for high-vacuum sections. The gauges’ RS232 output streams pressure and internal temperature, allowing correction for thermal effects. Typical acceptance criteria in coating tools: <10⁻⁵ Torr·L/s for process chambers.
5. Using Pirani for Rough Leak Detection
The VG-SP205 excels at detecting gross leaks during roughing because its thermal-conductivity principle responds in milliseconds near atmosphere. A sudden pressure bump or failure to reach 10⁻² Torr in the expected time points to a large leak (O-ring not seated, loose flange, or cracked weld).
In multi-chamber tools, mount one VG-SP205 on each load-lock foreline. Its 0–10 V analog output gives instant visual feedback on the tool HMI, while RS232 logs the full curve for post-run analysis. Because the Pirani is maintenance-free (3–5 year platinum filament life), it serves as the first line of defense without adding labor.
6. High Vacuum Leak Detection with Cold Cathode
Below 10⁻³ Torr the VG-SM225’s Penning discharge provides the sensitivity needed for fine leaks. Its software automatically manages high-voltage startup and shutdown, protecting electrodes during valve cycling or ROR tests. A slow rise in ion current after isolation—visible in the RS232 stream—reveals leaks as small as 10⁻⁸ Torr·L/s.
The gauge’s field-cleanable stainless-steel electrodes (polish with 500-mesh sandpaper in 10⁻³ Torr) prevents false shutdowns while still capturing true leak-induced plateaus.
7. Data Logging Strategy
Effective trend analysis requires consistent, high-resolution data. Connect both gauges via their RJ45/RS232 ports to a simple Ethernet gateway or directly to the tool PLC/SCADA. Log at 1-second intervals during pump-down and every 10 seconds during steady state. Store raw pressure, status codes, and internal temperature in a time-stamped CSV or SQL database.
Free Python scripts (available on request) plot log P vs. time, overlay Pirani and cold-cathode curves, and flag plateaus automatically. For facilities with multiple tools, centralize logs in a dashboard that triggers e-mail alerts when dP/dt exceeds preset thresholds. The customizable RS232 protocol (5–10 unit minimum) lets both gauges share the same data frame, simplifying integration and reducing cabling.
8. Creating Maintenance SOP
A written standard operating procedure (SOP) ensures repeatability and compliance. Sample outline for daily/weekly checks:
- Review last 24-hour pump-down curves via dashboard; flag any plateau >30 s.
- Perform 5-minute ROR test on each chamber after reaching base pressure; calculate Q = V × dP/dt.
- If Q > acceptance limit, isolate sections starting with load-lock (use VG-SP205) then process chamber (use VG-SM225).
- Cross-check with Pirani/cold-cathode overlap at 10⁻³ Torr; discrepancy >15 % triggers cleaning or helium spray.
- Log results, electrode condition (for VG-SM225), and corrective action; schedule quarterly full ROR with volume calibration.
- Replace VG-SP205 transmitter if filament status code appears; clean VG-SM225 electrodes if startup time >10 min at 10⁻⁶ Torr.
This SOP typically reduces leak-related downtime by 60–70 % within three months. The low acquisition cost and field-repairable design of the Poseidon gauges keep the program economical—spares inventory is minimal (one of each per 10 installed units).
Pressure trend analysis with the VG-SP205 and VG-SM225 turns routine monitoring into a powerful leak-detection tool. Their digital output, complementary ranges, and built-in diagnostics eliminate guesswork while fitting every budget. Facilities that adopt these methods achieve faster pump-downs, higher uptime, and documented process control—critical advantages in today’s competitive vacuum coating and semiconductor markets.
Download the VG-SP205 User Manual and VG-SM225 User Manual for complete RS232 protocol examples, status-code tables, and ROR test wiring diagrams. For new installations we provide free Python logging scripts and custom protocol files. Contact our applications team today for a system audit—we’ll help you implement trend-based leak detection that pays for itself in the first quarter.

