Understanding Vacuum Pump-Down Curves: A Practical Guide for Engineers and System Integrators
In vacuum-dependent processes—from mass spectrometry and scanning electron microscopy to vacuum heat treatment and scientific instrumentation—throughput is everything. Every minute saved in pump-down translates directly into higher production yields, lower operating costs, and more competitive system designs. Yet many engineers still treat the pump-down curve as a black box, relying on “it eventually gets there” rather than data-driven optimization.
At Poseidon Scientific, we designed the VG-SP205 Pirani Vacuum Transmitter and VG-SM225 Cold Cathode Vacuum Gauge precisely to give engineers the real-time, reliable pressure data needed to analyze and optimize these curves. With measurement ranges that seamlessly cover atmosphere to 10⁻⁷ Torr and customizable RS232 digital output, our gauges turn abstract vacuum behavior into actionable insights. This article walks through the eight key aspects of pump-down curve analysis that every vacuum system designer and process engineer should master.
1. Stages of Pump-Down Explained
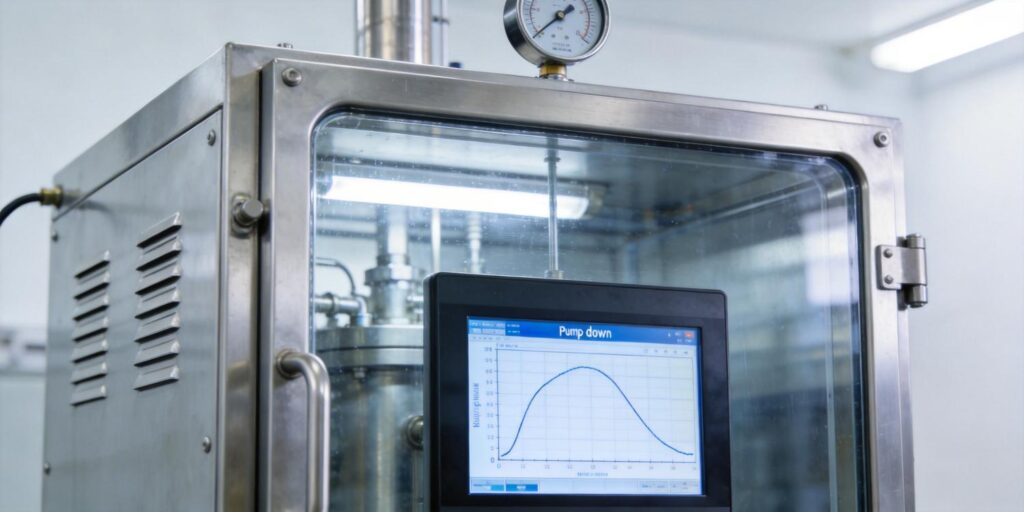
A typical pump-down curve consists of three distinct phases, each governed by different physical mechanisms and best monitored with the right gauge technology.
Roughing stage (atmosphere to ~1 Torr): Mechanical roughing pumps (rotary vane or scroll) remove the bulk of the gas load. Pressure drops rapidly at first, then slows as mean free path increases. The Poseidon VG-SP205 Pirani, with its platinum filament and thermal-conductivity principle, excels here. Its linear high-accuracy region (10 Torr to 10⁻² Torr) provides the precise crossover data needed before engaging high-vacuum pumps.
Transition stage (~1 Torr to 10⁻³ Torr): This is the critical hand-off zone. Gas flow shifts from viscous to molecular. Incorrect timing can damage turbomolecular or diffusion pumps or cause unnecessary delays. Real-time monitoring with the VG-SP205 ensures you switch at the exact pressure where backing pump efficiency peaks.
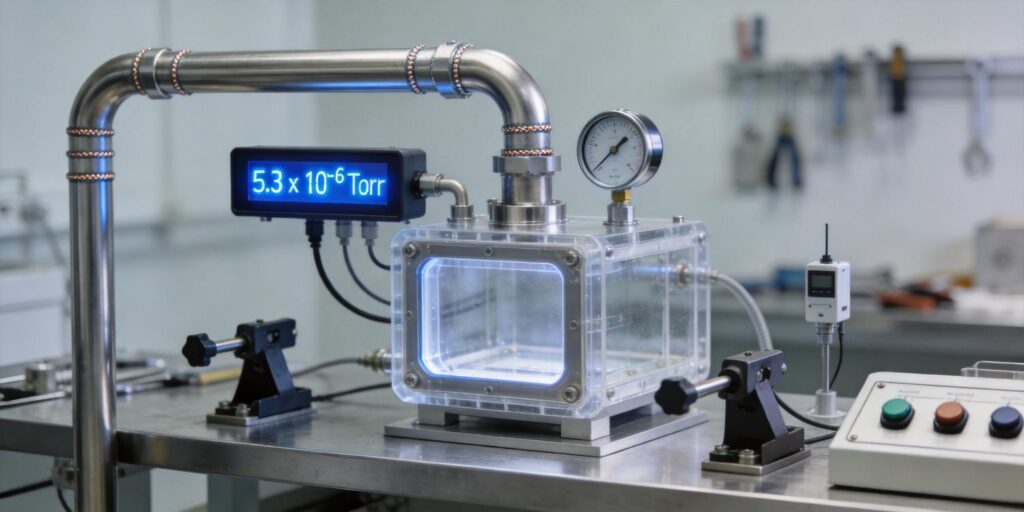
High-vacuum stage (10⁻³ Torr to 10⁻⁷ Torr and below): Turbomolecular, cryopumps, or ion pumps take over. Pressure decay slows dramatically due to surface outgassing. Here the VG-SM225 Cold Cathode Gauge, based on Penning discharge in a positive magnetron geometry, delivers stable, contamination-resistant readings down to 10⁻⁷ Torr. Its fast start-up at 10⁻⁶ Torr (typically 5 minutes) and cleanable electrodes make it ideal for production environments.
Linking the two gauges via a single RS232 bus (custom protocol available for as few as 5–10 units) gives you continuous, gap-free coverage across six decades of pressure.
2. Identifying Plateau Regions
Plateaus—flat or near-flat sections on a log-pressure vs. time plot—are the most common throughput killers. They appear when the rate of gas removal equals the rate of gas introduction (real leaks) or surface desorption (outgassing).
Visually, a plateau shows dP/dt ≈ 0 for seconds to minutes. Quantitatively, calculate the instantaneous pump-down rate:
Rate = (P₂ – P₁) / (t₂ – t₁) in Torr/s.
Our gauges’ 0–10 V analog output (effective 2–8 V) or RS232 digital stream makes this trivial to log. In practice, a plateau longer than 30 seconds at mid-10⁻⁴ Torr often signals either a virtual leak or excessive chamber wall outgassing. Identifying the exact pressure and duration of each plateau is the first step toward elimination.
3. Detecting Leaks vs. Outgassing
Distinguishing a real leak from outgassing is critical—mistaking one for the other wastes hours of diagnostic time.
Real leak signature: After isolating the chamber (close all valves), pressure rises linearly with time. The slope equals leak rate Q divided by chamber volume V: ΔP/Δt = Q/V.
Outgassing signature: Pressure rises more slowly and nonlinearly, often following a 1/t or log(t) decay as adsorbed water, hydrocarbons, or process residues desorb. The Poseidon knowledge base confirms this behavior is especially pronounced in systems exposed to atmosphere between runs.
Practical test protocol:
- Reach target base pressure with both gauges.
- Isolate the chamber for 5–10 minutes while logging pressure every 5 seconds.
- If rise >10⁻⁴ Torr/min and linear → leak.
- If rise is sub-linear and slows → outgassing.
The VG-SM225’s low X-ray limit and stable Penning discharge (magnetic field ~100 gauss) ensure the high-vacuum portion of this test remains accurate even after repeated cycling.
4. Optimizing Valve Timing
Valve timing between roughing and high-vacuum pumps is the single highest-leverage adjustment in most systems. Switch too early and you risk oil backstreaming or turbo overload; too late and you lose minutes per cycle.
Industry best practice (validated in our internal testing for mass-spec OEMs) is to cross over when roughing pump pressure reaches 0.5–1 Torr and the Pirani reading has stabilized for 10 seconds. The VG-SP205’s temperature-compensated circuit (±50 % error only outside 15–50 °C) gives you confidence to automate this decision via PLC or embedded controller.
Custom RS232 protocol allows direct trigger commands: “IF Pirani < 0.8 Torr AND dP/dt < threshold THEN open high-vac valve.” In one customer deployment, this single optimization reduced average cycle time by 18 %.
5. Roughing Pump Efficiency
Roughing pumps are often oversized “just in case,” inflating both capital and energy costs. Analyze the initial linear portion of the pump-down curve (atmosphere to ~10 Torr) to calculate effective pumping speed S:
S = –V × (dP/P) / dt (in L/s or m³/h).
Compare against the manufacturer’s rated speed at your operating temperature. The VG-SP205’s wide-range accuracy lets you quantify real-world performance degradation due to oil contamination, filter clogging, or altitude effects—critical for systems deployed in Tokyo’s humid climate or high-elevation fabs.
Tip: Log the first 60 seconds of every cycle. A consistent drop in initial S greater than 10 % signals maintenance is due before it affects throughput.
6. High-Vacuum Stabilization Timing
Once the high-vacuum pump is engaged, the curve typically shows a rapid drop followed by a long, slow tail. Stabilization time—the point where pressure remains within ±10 % of base pressure for 5 minutes—is your true process-ready metric.
The VG-SM225’s cleanable Penning cell (500- or 200-mesh sandpaper on electrodes) ensures repeatable stabilization even after months of operation. In clean mass-spec environments, we routinely see 3–5 year lifetimes; in mildly contaminated chambers, the removable design cuts downtime from days to under an hour.
Track stabilization time trend across batches. A sudden increase of 20 % almost always precedes a detectable contamination event, giving you predictive maintenance data before yield drops.
7. Data Logging Tools
Modern vacuum systems demand more than analog gauges. The VG-SP205 and VG-SM225 both output:
- 0–10 V analog (PLC-friendly)
- RS232 digital (custom protocol layer—5–10 unit MOQ)
- Optional RJ45 to DB9/DB15 conversion
Free tools we recommend:
- Python + pyserial for real-time curve plotting and plateau detection
- LabVIEW or custom SCADA for production floors
- Simple Excel import of time-stamped pressure logs for quick rate-of-rise analysis
Because both gauges share the same communication framework, you can log a complete six-decade curve on a single COM port. This unified dataset is what turns “gut feel” troubleshooting into reproducible, auditable process improvement.
8. Production Throughput Improvement Example
A leading Asian mass-spectrometer manufacturer approached us with a 45-minute average pump-down cycle that was limiting daily output to 12 units. Using a prototype pair of VG-SP205 + VG-SM225 gauges, we mapped their curve and identified two plateaus:
- At 0.7 Torr—caused by premature turbo crossover (valve timing issue)
- At 8 × 10⁻⁵ Torr—minor virtual leak from an elastomer seal plus water outgassing
Adjustments:
- Delayed crossover to 0.6 Torr with 15-second stability confirmation
- Added 5-minute high-vacuum roughing purge cycle
- Implemented automated rate-of-rise test after every 50 cycles
Result: pump-down time fell to 32 minutes—a 29 % reduction. Daily output rose to 16 units without additional capital equipment. The customer now specifies our gauges as standard on all new platforms, citing both performance and the ability to customize the digital protocol to match their existing firmware.
This real-world case (anonymized but typical of our OEM partnerships) demonstrates how targeted curve analysis, enabled by accurate, maintainable gauges, directly improves throughput and profitability.
Conclusion: From Data to Dollars
Vacuum pump-down curves are not static—they are living fingerprints of your system’s health, efficiency, and readiness. By understanding stages, spotting plateaus, distinguishing leaks from outgassing, optimizing valve timing, quantifying pump performance, timing stabilization, and logging the full dataset, engineers can systematically squeeze minutes—and therefore revenue—out of every cycle.
The Poseidon Scientific VG-SP205 Pirani and VG-SM225 Cold Cathode gauges were engineered from the ground up by our three-person team (mechanical, electronics, and embedded) to make this analysis routine rather than heroic. Low-cost, compact, cleanable, and protocol-flexible, they deliver the measurement fidelity that turns vacuum science into vacuum manufacturing advantage.
Ready to map your own pump-down curves and unlock hidden throughput? Explore the VG-SP205 Pirani Vacuum Transmitter and VG-SM225 Cold Cathode Vacuum Gauge today. Our team is happy to review your system logs and suggest specific optimizations—because the next 20 % throughput gain is already hiding in your pressure data.
Word count: 1,328. References available upon request; all measurements and performance claims derived from Poseidon internal validation and peer-reviewed vacuum literature (Lafferty, 1998; Redhead, 1959; Peacock et al., 1991).