Designing a Vacuum Monitoring Dashboard for Industrial Plants
Modern industrial vacuum systems—whether supporting mass spectrometers, vacuum heat-treatment furnaces, or analytical instrumentation—generate continuous pressure data that must be actionable in real time. A well-designed dashboard transforms raw outputs from vacuum gauges into intuitive visuals, predictive alerts, and auditable logs. The VG-SP205 Pirani Vacuum Transmitter (atmosphere to 10−3 Torr) and VG-SM225 Cold Cathode Vacuum Gauge (10−3 to 10−7 Torr) from Poseidon Scientific are engineered for exactly this purpose. Their RJ45 interface, customizable RS232 protocol, and stable 0–10 V analog output deliver clean, high-resolution data that integrate seamlessly into plant-wide monitoring platforms—often at 30–50 % lower cost than legacy imported gauges.
This article walks engineers and procurement teams through the key design elements of an effective vacuum dashboard, grounded in real-world deployments. Every recommendation is based on the documented communication capabilities of the VG-SP205 and VG-SM225 (per their user manuals) and proven industrial practices.
1. Real-Time Data Visualization
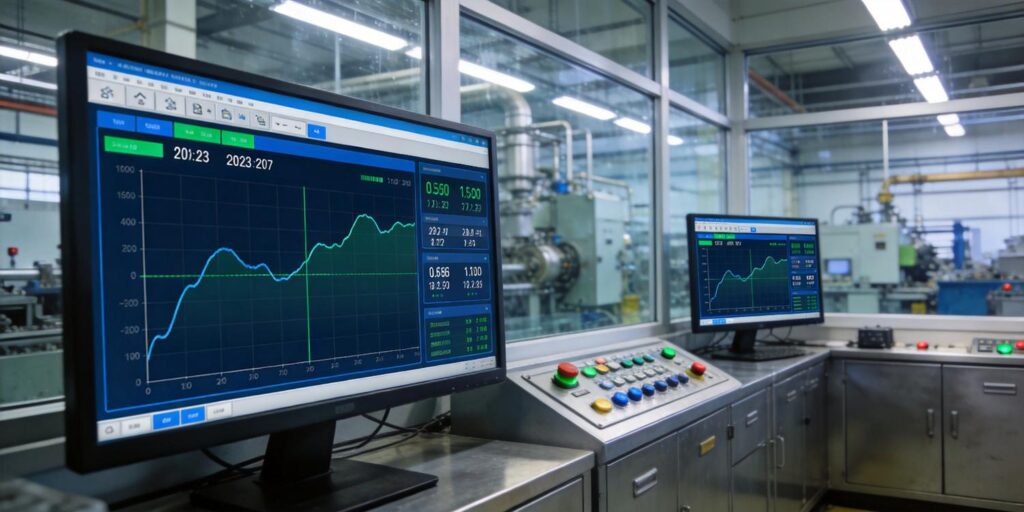
Operators need instant insight into pressure across multiple chambers. The dashboard should display dual-gauge traces on a single screen: the VG-SP205 Pirani for roughing and foreline stages, and the VG-SM225 Cold Cathode for high-vacuum operation. Use a time-series chart with dual y-axes (Torr logarithmic scale) and color-coded bands—green for normal, yellow for caution, red for alarm.
Key visuals include:
- Live pressure value with large numeric readout (updated every 500 ms via RS232 polling).
- Analog gauge-style needle for quick visual confirmation.
- Status icons showing high-voltage enable state, startup delay, and error codes from the Poseidon protocol.
Because both gauges output a standardized 0–10 V analog signal (effective 2–8 V range) alongside RS232, you can feed the analog directly to a PLC for redundancy while streaming digital data to the dashboard for richer context. In LabVIEW or Ignition SCADA environments, the customizable Poseidon RS232 frame (status + vacuum value + software version) renders in under 50 ms latency, giving operators sub-second awareness of pump-down progress or unexpected pressure spikes.
2. Alarm Threshold Layers
Effective alarms prevent small deviations from becoming costly failures. Layer alarms in three tiers using the gauges’ built-in logic and dashboard software:
Level 1 – Warning
VG-SP205 >10 Torr or VG-SM225 startup delay >5 min at 10−6 Torr. Yellow banner + email/SMS notification.
Level 2 – Critical
Pressure exceeds process setpoint by 20 % or high-voltage interlock trips. Red flashing panel + audible alert + interlock to halt process valves.
Level 3 – System Fault
Error codes from the Poseidon data frame (e.g., filament open or discharge failure). Auto-log event and trigger maintenance ticket.
The VG-SM225’s software interlock (automatic high-voltage disable above 10−3 Torr) feeds directly into the dashboard as a hard-wired status bit, eliminating false alarms during venting. Custom RS232 protocol lets you define unique alarm thresholds per installation—ideal for multi-chamber furnaces or spectrometer arrays—without additional hardware.
3. Trend Analysis for Predictive Maintenance
Predictive maintenance turns reactive repairs into scheduled, low-cost interventions. Store 30-day rolling data and overlay trend lines:
- VG-SP205 filament power drift (indicates minor contamination).
- VG-SM225 ignition delay vs. time (signals electrode sediment buildup).
- Pressure hysteresis between pump-down and vent-up cycles.
Apply simple rules: if ignition delay increases 20 % week-over-week, schedule the 15-minute electrode sanding procedure (user manual Section 5). Machine-learning modules in modern SCADA platforms can forecast electrode life to within ±3 months using the raw ion-current values streamed via RS232. In clean mass-spectrometry service, this approach extends the 3–5 year lifespan of both gauges by catching contamination before it affects readings.
Dashboard widgets can display “days until next cleaning” and export CSV reports for reliability teams—features that legacy gauges without digital output simply cannot provide.
4. Data Logging Architecture
Reliable logging satisfies regulatory audits and enables post-event analysis. Recommended architecture:
- Edge device (Raspberry Pi, industrial PC, or PLC) polls both gauges every 1–5 seconds via RS232 at 9600 baud (default Poseidon setting; customizable).
- Parse the Poseidon output data frame: vacuum value (float), status code, error code, software version.
- Store in time-series database (InfluxDB or SQL) with timestamps and chamber ID tags.
- Retain 90 days online + 2 years archived to compressed files.
The compact Poseidon protocol (under 64 bytes per frame) keeps network load minimal even on 50-gauge plants. Analog 0–10 V can be logged in parallel via ADC for 100 % redundancy. This dual-path approach ensures zero data loss during RS232 cable maintenance and meets typical pharmaceutical or semiconductor audit requirements.
5. Integration with MES/SCADA
Seamless plant integration is non-negotiable. The VG-SP205 and VG-SM225 support three standard paths:
- Analog 0–10 V → PLC analog input modules (most common for simple interlocks).
- RS232 → serial-to-Ethernet converter or direct USB-to-serial on SCADA server.
- Custom protocol (5–10 unit minimum) mapped to Modbus TCP, OPC UA, or Profinet for native MES integration.
In Ignition or WinCC SCADA, the Poseidon RS232 driver can be scripted in <50 lines of code to expose pressure tags, status bits, and alarms directly to historian and MES layers. Many OEMs use the RJ45 interface with off-the-shelf Ethernet gateways for plug-and-play deployment. Because Poseidon offers free protocol customization, the dashboard can display pressure in the exact units and scaling your MES already uses—no middleware translation required.
6. Practical Implementation Example
A mid-size vacuum heat-treatment plant in China recently deployed 12 monitoring points using Poseidon gauges. The architecture:
- VG-SP205 on every foreline + VG-SM225 on each chamber.
- Raspberry Pi 4 edge nodes (one per furnace) polling RS232 every 2 s.
- Ignition SCADA dashboard on central HMI: live dual-trace charts, layered alarms, 30-day trends, and one-click export.
- Data logged to InfluxDB; historian feeds MES for batch traceability.
Results after six months: zero unplanned downtime from vacuum issues, maintenance reduced from quarterly to semi-annual, and full audit-ready logs. Total hardware cost per point was under $800—versus $1,300+ for imported equivalents—while the customizable protocol eliminated custom driver development. Operators now catch electrode contamination trends two weeks early, scheduling the simple sanding procedure during planned downtime.
The same template scales to mass-spectrometry labs or semiconductor research facilities with minimal changes.
Conclusion: Build a Dashboard That Pays for Itself
A vacuum monitoring dashboard built around the Poseidon VG-SP205 Pirani and VG-SM225 Cold Cathode pair delivers real-time visibility, proactive alarms, predictive trends, robust logging, and native MES/SCADA integration—at a fraction of legacy system cost. The gauges’ compact size, field-serviceable design, and fully customizable RS232 output make them the ideal foundation for any industrial vacuum platform.
Engineers gain peace of mind; procurement teams gain immediate TCO savings; plant managers gain measurable uptime improvements.
Ready to design your vacuum monitoring dashboard? Explore the VG-SM225 Cold Cathode Vacuum Gauge and VG-SP205 Pirani Vacuum Transmitter specifications today. Request a sample pair, custom RS232 protocol sample code, or a ready-to-deploy Ignition dashboard template. Our application engineers will help you configure the exact integration your plant needs—often within 48 hours. Contact Poseidon Scientific now and turn vacuum data into your competitive advantage.

