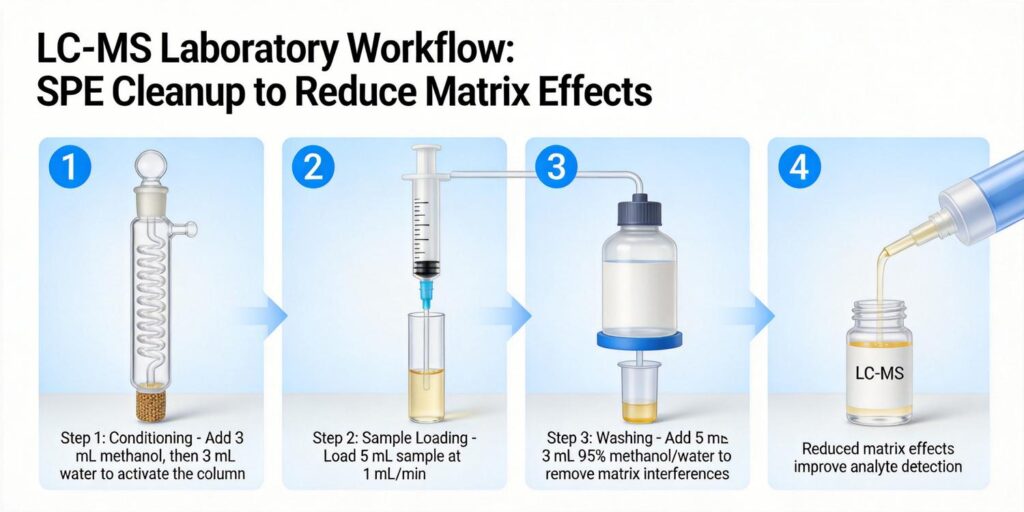

Overview of Validation Requirements for SPE Methods
Solid-phase extraction method validation is a critical process that ensures analytical laboratories can consistently produce reliable, accurate, and reproducible results. According to regulatory guidelines and industry best practices, SPE method validation must demonstrate that the extraction procedure is suitable for its intended purpose across various sample matrices and concentration ranges.
A robust SPE method should yield near-quantitative recovery over the entire desired concentration range with acceptable precision both within the same laboratory and between different laboratories, as well as over extended periods of time. SPE represents just one step in the complete analytical workflow, which typically includes sample pretreatment, extraction, elution, and analysis. The attention paid to SPE method design should be no less than that given to the analytical method itself.
Key validation requirements include establishing method specificity, linearity, accuracy, precision, recovery, matrix effects, limits of detection and quantification, and robustness. These parameters must be evaluated under conditions that simulate real-world applications, using representative sample matrices rather than just aqueous solutions, as matrix components can dramatically influence sorbent-analyte and analyte-sample interactions.
Accuracy and Precision Evaluation
Accuracy and precision represent fundamental validation parameters that determine the reliability of SPE methods. Accuracy refers to how close measured values are to the true value, while precision measures the reproducibility of results under specified conditions.
For SPE method validation, accuracy is typically evaluated through recovery studies using fortified samples at multiple concentration levels. According to European Commission guidelines for aflatoxin analysis, recovery criteria vary by concentration range: for concentrations less than 1 μg/kg, recoveries should range between 50-120%, while for concentrations between 1-10 μg/kg, recoveries should fall within 70-110%.
Precision evaluation includes both repeatability (intra-assay precision) and reproducibility (inter-assay precision). Repeatability represents agreement between results of successive measurements conducted under identical conditions: same procedure, same analyst, same instrument, same location, and repetitions within a short time interval. Relative standard deviations (RSD) should typically be less than 20% for trace-level analyses, though more stringent criteria may apply for higher concentration ranges.
Automated SPE systems can significantly improve precision by eliminating variables associated with manual techniques. Automated equipment performs identical sequences of steps on each sample, reducing manual interventions and minimizing opportunities for error. Studies have shown that automated SPE workstations can yield recoveries equivalent to or better than manual methods while providing enhanced consistency and reduced sample reruns.
Recovery and Matrix Effect Measurements
Recovery assessment is central to SPE method validation, with analysts typically aiming for 100% recoveries to confirm quantitative extraction and elution. Values exceeding 100% may indicate contamination from sources other than the sample, while recoveries below 100% could suggest poor technique, low binding capacity (breakthrough), incomplete elution, or analyte decomposition.
Matrix effects (ME) represent another critical validation parameter, particularly for trace-level analyses. Matrix effects are evaluated by comparing calibration slopes in matrix-matched solutions versus solvent-only solutions using the formula:
ME% = 100 × (1 – Sm/Ss)
where Ss is the slope in solvent and Sm is the slope in matrix. No matrix effect is observed when ME% equals 100%. Values above 100% indicate signal enhancement, while values below 100% signify signal suppression. According to SANTE/11945/2015 guidelines, matrix effects up to 20% are generally acceptable for trace contaminant analysis in food matrices.
Research on aflatoxin extraction from cornmeal demonstrated matrix effects of approximately 20% for G2 and G1 aflatoxins and 11% for B2 and B1 aflatoxins, all within acceptable limits. These acceptable matrix effects allow quantification using solvent-based calibration curves while avoiding false positive results.
Limit of Detection and Quantification Considerations
Limit of detection (LOD) and limit of quantification (LOQ) establish the sensitivity boundaries of SPE methods. LOD represents the lowest analyte concentration that can be reliably detected but not necessarily quantified, while LOQ defines the lowest concentration that can be quantified with acceptable accuracy and precision.
For aflatoxin analysis in cornmeal using matrix solid-phase dispersion (MSPD) with HPLC-FD detection, reported LODs ranged from 0.24 to 0.32 ng/g, with LOQs between 0.80 to 1.05 ng/g. These values demonstrate that SPE methods coupled with appropriate detection techniques can achieve sensitivity comparable to or better than more sophisticated methods like HPLC-tandem MS for certain applications.
Method validation should include LOD and LOQ determination at multiple fortification levels. For example, in aflatoxin method validation, fortification levels included concentrations equivalent to LOQ, 5-fold LOQ, and 10-fold LOQ for AFLA G2, and 2-, 10-, and 20-fold LOQ for AFLAs G1, B2, and B1, respectively. Each level should be extracted in triplicate and analyzed multiple times to establish statistical confidence.
Robustness Testing Procedures
Robustness testing evaluates how method performance withstands small, deliberate variations in method parameters. A robust SPE method should maintain acceptable recovery and precision despite minor changes in experimental conditions.
Key parameters to test for robustness include:
- Flow rates: Evaluate at low, nominal, and high values (e.g., 10.0, 12.0, and 14.0 mL/min)
- Solvent composition: Test variations in organic solvent percentages (e.g., 15%, 20%, 25% methanol)
- Volumes: Assess slight variations in reagent volumes (e.g., 2.8, 3.0, 3.2 mL)
- pH conditions: Test buffer pH variations within acceptable ranges
- Cartridge drying times: Evaluate different drying durations when required
Robustness testing should be systematic, changing only one variable at a time while keeping others constant. The goal is to identify parameter values around which results do not vary significantly, ensuring the method remains reliable under normal laboratory variations. All robustness data should be documented and stored for future troubleshooting reference.
Documentation for Regulatory Compliance
Comprehensive documentation is essential for regulatory compliance and method transfer between laboratories. Proper documentation should include:
- Method development records: Detailed notes on parameter optimization, including sorbent selection, solvent choices, flow rates, and volumes
- Validation protocol: Clearly defined experimental design, acceptance criteria, and statistical methods
- Raw data and calculations: Complete records of all experiments, including chromatograms, calibration curves, and statistical analyses
- System suitability records: Documentation of instrument performance and sorbent batch consistency
- Quality control data: Records of control samples, calibration verifications, and proficiency testing results
- Change control documentation: Records of any method modifications and revalidation efforts
Automated SPE systems provide advantages in documentation by electronically recording precise details of every extraction step, creating formal documentation of sample preparation procedures. This electronic record-keeping supports compliance with increasingly stringent regulatory requirements in pharmaceutical, environmental, and food safety laboratories.
Example Validation Protocol
The following example protocol outlines a comprehensive SPE method validation approach:
1. Method Scope and Objectives
Define the target analytes, sample matrices, concentration ranges, and intended applications. Specify the analytical technique (HPLC, GC, LC-MS, etc.) and detection method.
2. Experimental Design
Prepare fortified samples at minimum three concentration levels across the analytical range. Include blank matrix samples and solvent blanks. Perform extractions in triplicate for each concentration level, with multiple injections per extract to assess both extraction and analytical variability.
3. Specificity and Selectivity
Demonstrate that the method specifically extracts target analytes without significant interference from matrix components. Compare chromatograms of blank matrices, fortified samples, and analyte standards.
4. Linearity and Range
Establish calibration curves using matrix-matched standards across the validated concentration range. Evaluate linearity through correlation coefficients, residual plots, and lack-of-fit tests.
5. Accuracy and Recovery
Calculate percent recovery at each fortification level using the formula: Recovery% = (measured concentration / fortified concentration) × 100. Compare results against established acceptance criteria (e.g., 70-120% recovery with RSD < 20%).
6. Precision
Determine repeatability (within-run precision) and intermediate precision (between-run, between-day, between-analyst precision). Calculate mean, standard deviation, and relative standard deviation for each concentration level.
7. Matrix Effects
Prepare calibration curves in solvent and matrix extracts. Calculate matrix effect percentages and evaluate against acceptance criteria (typically < 20% for trace analyses).
8. Limits of Detection and Quantification
Determine LOD and LOQ based on signal-to-noise ratios (typically 3:1 for LOD and 10:1 for LOQ) or statistical approaches using standard deviation of blank responses and slope of calibration curves.
9. Robustness
Systematically vary critical method parameters (flow rates, solvent compositions, volumes, pH) and evaluate impact on recovery and precision. Document acceptable operating ranges for each parameter.
10. Stability
Assess analyte stability in sample matrices, during extraction, and in final extracts under various storage conditions and time periods.
11. Documentation and Reporting
Compile all validation data into a comprehensive report including experimental procedures, raw data, calculations, statistical analyses, and conclusions regarding method suitability.
This structured validation approach ensures SPE methods meet regulatory requirements while providing reliable performance for routine analytical applications. Proper validation not only demonstrates method suitability but also establishes performance benchmarks for ongoing quality control and method transfer between laboratories.