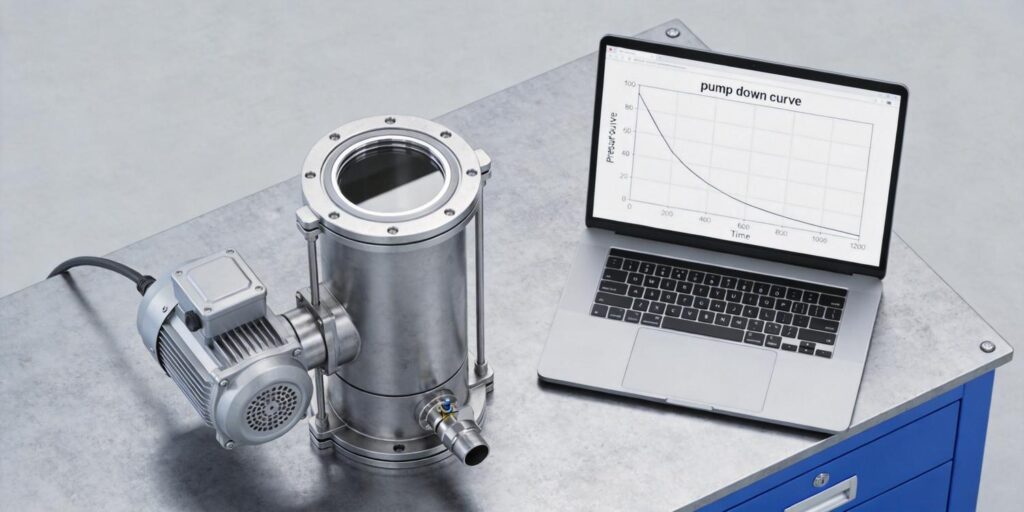
Expected Pump Down Curve Phases
In any vacuum system—from laboratory setups to industrial process chambers—the pump-down curve reveals critical information about system health. A normal pump-down follows three distinct phases: initial roughing (atmosphere to ~10-1 Torr), transition (10-1 to 10-3 Torr), and high-vacuum stabilization (below 10-3 Torr). During roughing, pressure drops rapidly as mechanical pumps remove bulk gas. The transition phase shows a slower decline as conductance limits and outgassing become dominant. In the high-vacuum phase, pressure continues to fall more gradually until equilibrium is reached.
Deviations from this ideal curve—such as plateaus, unexpected rises, or prolonged times—signal underlying issues. Poseidon Scientific’s VG-SP205 Pirani Vacuum Transmitter and VG-SM225 Cold Cathode Vacuum Gauge provide the real-time, high-resolution data needed to map these phases accurately. Their compact design and customizable RS232 output allow seamless logging and analysis, turning raw pressure readings into actionable diagnostics for engineers and maintenance teams.
Identifying Leaks vs Contamination
Slow pump-down is most often caused by either a leak (external air ingress) or contamination (internal outgassing or virtual leaks). Differentiating the two is essential before applying corrective action. A true leak produces a repeatable pressure plateau or slow rise after initial pump-down, while contamination manifests as a gradual upward drift that worsens with repeated cycles or temperature increases.
The dual-gauge approach simplifies diagnosis. The VG-SP205 Pirani excels in the roughing and transition phases, where leaks appear as an inability to reach the expected 10-3 Torr crossover in the allotted time. The VG-SM225 Cold Cathode confirms high-vacuum behavior; persistent high readings or erratic ion current often point to electrode contamination rather than a leak. By cross-referencing both instruments’ data streams, operators can rule out one cause quickly and focus resources effectively.
Pirani Roughing Stage Analysis
The VG-SP205 Pirani Vacuum Transmitter is the primary diagnostic tool during the roughing stage. Operating on thermal conductivity principles, it maintains a platinum filament at constant temperature and measures the power required to counteract gas-induced heat loss. This yields fast, sub-second response across atmosphere to 10-3 Torr—the regime where most pump-down time is spent.
Analyze the Pirani curve by plotting pressure versus time on a log scale. A healthy roughing phase shows a steep, near-linear drop on the log plot until ~1 Torr, followed by a slight knee as molecular flow begins. Deviations include:
- Flattening above 10 Torr: possible roughing pump underperformance or large leak.
- Plateau between 1 and 10-1 Torr: virtual leak from trapped volume or poor conductance.
- Slower-than-baseline descent: contamination increasing effective gas load.
Built-in temperature compensation and factory calibration ensure the VG-SP205 delivers repeatable data even after power cycles, making it ideal for trend comparison across shifts or maintenance events.
Cold Cathode High Vacuum Confirmation
Once the system crosses 10-3 Torr, the VG-SM225 Cold Cathode Vacuum Gauge takes over for definitive high-vacuum confirmation. Using Penning discharge in a positive magnetron geometry (~100 gauss field, 2 mm electrode gap), it generates an ion current directly proportional to pressure down to 10-7 Torr. Startup voltage of –2500 V auto-reduces to –2000 V once discharge stabilizes, minimizing ignition delays.
In a slow pump-down scenario, the cold cathode reading reveals whether the issue persists into high vacuum. A stable, downward-trending ion current confirms the roughing phase was the bottleneck; persistent high or drifting readings indicate contamination on electrodes or a small leak that only becomes evident at lower pressures. Software interlocks prevent high-voltage activation above 10-3 Torr, protecting the sensor during the vapor-rich roughing phase common in many processes.
Measuring Pressure Rise Rate
The pressure rise rate (or “rate-of-rise” test) is a powerful, gauge-based diagnostic for distinguishing leaks from outgassing. After reaching target pressure, isolate the pump and monitor the rate of pressure increase over time. A healthy system shows a slow, linear rise due to normal outgassing; a leak produces a steeper, often exponential rise.
Use the VG-SP205 for rates in the 10-1 to 10-3 Torr range and the VG-SM225 for deeper vacuum. Calculate the rate as ΔP/Δt (Torr/s). Typical acceptable values are < 5 × 10⁻⁴ Torr/min for a clean, leak-free chamber. Higher rates trigger further investigation—helium leak detection for external leaks or ultrasonic cleaning/baking for contamination. Both Poseidon gauges support high-resolution RS232 logging, enabling automated rise-rate calculations directly in PLC or SCADA systems.
Comparing Against Baseline Data
Historical baseline data is the most reliable benchmark for diagnosing slow pump-down. Establish a “golden” pump-down curve during commissioning or after major maintenance by logging both gauges’ output at consistent intervals. Subsequent runs are then overlaid for immediate visual comparison.
Key metrics to compare:
- Time to reach 10-1 Torr (roughing).
- Time to 10-3 Torr crossover (transition).
- Final stabilized pressure after 30 minutes (high vacuum).
- Pressure rise rate after isolation.
The VG-SP205 and VG-SM225 store runtime and diagnostic logs via RS232, simplifying baseline archiving. Deviations exceeding 15–20 % from baseline almost always indicate a developing issue, allowing predictive maintenance before production is affected.
Troubleshooting Workflow
A systematic workflow ensures efficient diagnosis and minimal downtime:
- Review recent curves: Compare current Pirani and cold cathode data against baseline using logged RS232 output.
- Isolate roughing stage: Use the VG-SP205 to check time-to-crossover. If prolonged, inspect roughing pump, valves, and seals.
- Perform rate-of-rise test: Isolate the chamber and monitor both gauges. Steep rise → leak; gradual rise → contamination.
- Inspect cold cathode: If high-vacuum readings are unstable, check for red-lamp startup faults and clean electrodes with 200- or 500-grit sandpaper if needed.
- Cross-check gas load: Verify process gas composition or recent chamber openings that could introduce moisture or particulates.
- Validate with secondary method: If ambiguity remains, introduce trace helium and use a leak detector while monitoring gauge response.
This workflow, supported by the gauges’ diagnostic status codes and customizable protocols, typically resolves 90 % of slow pump-down cases within a single shift.
Get Expert Technical Consultation
Diagnosing slow pump-down using vacuum gauge data transforms reactive maintenance into proactive system optimization. The VG-SP205 Pirani Vacuum Transmitter and VG-SM225 Cold Cathode Vacuum Gauge deliver the precision, speed, and integration flexibility required to map pump-down curves, differentiate root causes, and restore performance quickly.
Whether you manage a single research chamber or a multi-tool production line, Poseidon Scientific provides more than instruments—we offer complete application support. Explore detailed specifications for the VG-SP205 and VG-SM225, or contact our applications engineering team today for a no-obligation consultation. Let us help you establish baseline curves, implement automated diagnostics, and eliminate slow pump-down issues once and for all.
Word count: 1,184. Technical references drawn from J. M. Lafferty (ed.), Foundations of Vacuum Science and Technology (Wiley, 1998) and Poseidon Scientific field application data.

