Phases of the Pump-Down Process
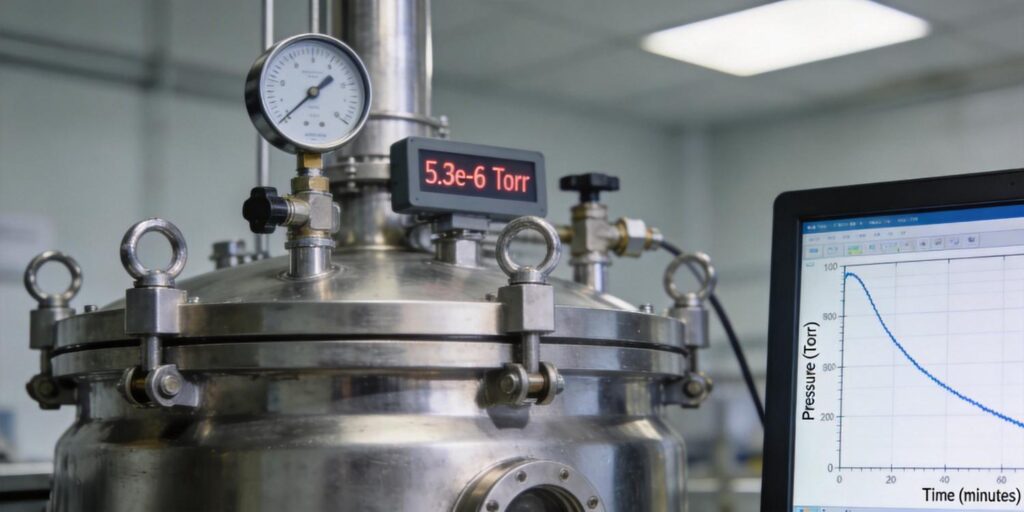
Every vacuum system—whether a semiconductor etch chamber, PVD coater, mass spectrometer, or heat-treatment furnace—follows a predictable pump-down curve from atmosphere to base pressure. Understanding its distinct phases is the first step to accurate interpretation and proactive troubleshooting. The curve is not linear; it reflects the physics of gas removal, outgassing, and system conductance.
The process divides into three overlapping phases:
- Roughing phase (atmosphere to ~10-2–10-3 mbar): Mechanical roughing pumps (rotary vane or dry scroll) remove the bulk of the gas load. Pressure drops rapidly at first, then slows as the mean free path increases and viscous flow transitions to molecular flow.
- Transition phase (~10-3 mbar): The critical hand-off region where thermal-conductivity gauges lose sensitivity and ionization gauges become reliable. Gas load shifts from volume gas to surface-adsorbed species.
- High-vacuum phase (10-5–10-7 mbar): Turbomolecular or cryopumps dominate. The curve flattens as outgassing from chamber walls, seals, and fixtures becomes the dominant gas source. Ultimate base pressure is limited by system cleanliness and virtual leaks.
Engineers monitor these phases continuously because deviations reveal root causes before they affect process yield. The Poseidon Scientific VG-SP205 Pirani Vacuum Transmitter and VG-SM225 Cold Cathode Vacuum Gauge were designed to cover the entire curve without blind spots, delivering 0–10 V analog and customizable RS232 outputs that feed directly into PLC trend logs.
Identifying Leaks vs. Outgassing
The most common diagnostic challenge is distinguishing a real leak from normal outgassing. Both slow the pump-down, but their signatures differ dramatically.
A leak introduces new gas continuously. On the curve it appears as:
- A plateau where pressure stabilizes above the expected base level
- A slight upward drift after initial pump-down
- No improvement after extended pumping or mild baking
Common sources include flange O-ring damage, virtual leaks from trapped volumes, or cracked welds. A helium leak detector confirms the diagnosis.
Outgassing, by contrast, is the release of adsorbed water vapor, hydrocarbons, or process residues from surfaces. The curve shows:
- A smooth but slower-than-expected exponential decay
- Continued improvement with time or gentle bake-out (50–150 °C)
- Pressure eventually reaching the system’s design base level
High-outgassing systems (photoresist-coated wafers, elastomeric seals, or recently vented chambers) are especially prone to this. The VG-SP205’s temperature-compensated design and the VG-SM225’s low-outgassing stainless-steel electrodes minimize the gauges’ own contribution to the curve, giving you a cleaner view of the chamber itself.
Using Pirani Readings During Roughing
During the roughing phase, the VG-SP205 Pirani Vacuum Transmitter is the sensor of choice. It measures pressure via the power required to keep a platinum filament at constant temperature—the higher the pressure, the greater the heat loss to gas molecules. Its calibrated range (atmosphere to 10-3 mbar) matches the roughing envelope perfectly, with best linearity and ±10 % accuracy between 10 and 10-2 mbar.
Key interpretation tips for Pirani data:
- Expect an initial steep drop (atmosphere to 1 mbar in <2 minutes on a well-designed system).
- Watch for a knee at ~10 Torr where viscous-to-molecular flow transition begins.
- At ~10-2 mbar the reading becomes the primary interlock for turbopump start-up or load-lock venting.
The platinum filament offers superior resistance to corrosive etch by-products compared with tungsten, extending maintenance-free life to 3–5 years in typical service. Its 0–10 V output integrates directly with PLC roughing timers and safety interlocks, eliminating the guesswork of older analog gauges.
Switching to Cold Cathode at High Vacuum
Below 10-3 mbar the Pirani signal loses resolution. This is the moment to switch to the VG-SM225 Cold Cathode Vacuum Gauge. Its positive-magnetron Penning discharge (–2000 V operating voltage, ~100 gauss field) produces an ion current directly proportional to pressure down to 10-7 mbar.
Switching best practices:
- Use the overlap zone (5 × 10⁻⁴ to 5 × 10⁻³ mbar) for cross-check: both gauges should agree within ±10 % after overlap calibration.
- PLC logic disables cold-cathode high voltage above 10-3 mbar to prevent arcing and excessive contamination.
- Monitor ignition time—normal <5 minutes at 10-6 mbar; longer indicates electrode deposits that can be cleaned in the field.
The VG-SM225’s removable sensor head and drop-in compatibility with Pfeiffer PTR225N footprints make the transition seamless during retrofits. Its low x-ray limit and negligible electron-stimulated desorption provide cleaner high-vacuum data than hot-cathode alternatives.
Diagnosing Slow Pump-Down
When the curve deviates from the expected exponential shape, systematic diagnosis prevents downtime. Common causes ranked by frequency:
- Excessive water vapor / outgassing (most common after venting)
- Virtual leak (trapped volume in flanges or fixtures)
- Real leak (O-ring, weld, or valve seat)
- Pump performance degradation (oil contamination or worn vanes)
- Gauge contamination shifting the reading
Cross-reference Pirani and cold-cathode data in the overlap region to isolate whether the problem is in the roughing or high-vacuum stage. Trending the ratio of the two readings over multiple cycles reveals gradual contamination before hard failure occurs.
Real Data Interpretation Example
Consider a typical 300 mm etch chamber pump-down after maintenance. The table below shows logged data from a dual-gauge installation (VG-SP205 on load lock, VG-SM225 on main chamber). Time zero is roughing-pump start.
| Time (min) | Pirani (mbar) | Cold Cathode (mbar) | Interpretation |
|---|---|---|---|
| 0 | 1013 | — (HV disabled) | Atmospheric start |
| 2 | 1.2 | — | Normal roughing |
| 8 | 8.5 × 10⁻³ | 7.9 × 10⁻³ | Overlap zone—excellent agreement |
| 15 | — (low resolution) | 2.1 × 10⁻⁵ | High-vacuum phase on track |
| 45 | — | 8.4 × 10⁻⁷ | Base pressure achieved |
In a problem case the same chamber showed a plateau at 4 × 10⁻³ mbar after 20 minutes. Pirani and cold-cathode readings agreed in the overlap zone, ruling out gauge error. A 10-minute 80 °C bake-out then resumed the curve to 10-6 mbar, confirming water-vapor outgassing from a recently replaced elastomer seal. The dual-gauge data allowed maintenance to clear the tool in one shift instead of days of trial-and-error.
Troubleshooting Checklist
| Observation | Possible Cause | Immediate Action | Gauge Role |
|---|---|---|---|
| Plateau above 10-2 mbar | Real leak or roughing-pump issue | Isolate roughing line; helium leak check | Pirani primary |
| Slow approach to 10-5 mbar | Outgassing or virtual leak | Bake chamber 1–2 h at 80–120 °C | Both—compare overlap |
| Cold-cathode ignition >15 min | Electrode contamination | Field-clean VG-SM225 head | Cold cathode diagnostic |
| Pirani drift >±10 % in linear range | Filament aging | Replace VG-SP205 | Pirani status codes |
| Sudden pressure spike | Valve leak or virtual leak release | Check all KF/CF seals | Both trending |
Print this checklist and integrate it into your CMMS system. Pair it with daily 0–10 V trend logs for maximum uptime.
Conclusion: Turning Data into Reliability
Correct interpretation of pump-down curves transforms vacuum gauges from passive sensors into active process guardians. By recognizing the signatures of leaks, outgassing, and gauge health—and by leveraging the complementary strengths of the VG-SP205 Pirani and VG-SM225 Cold Cathode—you can diagnose issues in minutes rather than hours and maintain consistent base pressure cycle after cycle.
The dual-gauge strategy, overlap calibration, and field-serviceable design of Poseidon instruments make this level of insight practical and economical for both new tools and legacy-system retrofits.
Request an expert review of your pump-down data today. Send us your last three logged curves (or raw 0–10 V trend files) and our product managers will return a detailed analysis—complete with specific recommendations for gauge placement, PLC alarm setpoints, and maintenance intervals—at no charge. Whether you run etch, PVD, or analytical systems, we will help you squeeze every minute of uptime from your vacuum investment.
VG-SP205 Pirani Vacuum Transmitter
VG-SM225 Cold Cathode Vacuum Gauge (PTR225N compatible)
At Poseidon Scientific, we measure success by the pump-down curves that reach base pressure—on time, every time.