Understanding Measurement Drift in Vacuum Gauges
Measurement drift in vacuum systems is the gradual, unintended shift in gauge output over time, even when the actual chamber pressure remains constant. For long-term processes—such as optical coating runs lasting 24–72 hours, vacuum heat treatment cycles, or continuous mass-spectrometer operation—drift as small as ±5 % can compromise film quality, trigger false interlocks, or invalidate process data. In high-value production environments, unchecked drift directly erodes yield and increases scrap costs.
At Poseidon Scientific, both the VG-SP205 Pirani Vacuum Transmitter and VG-SM225 Cold Cathode Vacuum Gauge incorporate temperature compensation circuitry and robust materials to minimize drift. Yet even the best-designed sensors experience some long-term change. This article examines the primary causes—thermal effects and electronic aging—then provides a practical prevention strategy based on our engineering experience and customer field data. Engineers and procurement teams will find actionable steps to maintain accuracy across months or years of continuous service.
Definition of Drift and Its Impact on Long-Term Processes
Drift is quantified as the change in indicated pressure (ΔP) divided by elapsed time, typically expressed in % per month or Torr per 1000 hours. It differs from short-term noise or hysteresis: drift is a slow, cumulative offset that only becomes visible when the gauge is compared against a reference standard or when process results deviate unexpectedly.
In long-term vacuum processes, drift affects:
- Process repeatability: Batch-to-batch film thickness or hardness varies.
- Safety interlocks: False pressure alarms or missed leak detections.
- Cost of ownership: Premature sensor replacement or unplanned downtime.
Our gauges are engineered for durability-first operation (3–5 year typical life), but real-world drift is influenced by operating environment and maintenance practices. Understanding the root causes allows proactive management rather than reactive replacement.
Thermal Effects: The Dominant Short- and Long-Term Contributor
Temperature is the leading cause of drift in thermal-conductivity (Pirani) and ionization (Cold Cathode) gauges. Even small ambient or process-induced temperature swings alter gas thermal conductivity, filament resistance, or electrode surface conditions.
For the VG-SP205 Pirani:
- The platinum filament’s resistance-temperature coefficient is intentionally large for sensitivity, but any uncompensated change shifts the power-to-pressure curve.
- Our dual circuit-plus-algorithm compensation keeps drift below ±2 % across the full 15–50 °C operating range.
- Prolonged exposure outside this window (common in unconditioned production floors) accelerates baseline shift.
For the VG-SM225 Cold Cathode:
- Penning discharge current is weakly temperature-dependent through gas density and electrode work function.
- Light drift (typically < 3 % per 1000 hours) appears as a gradual reduction in indicated pressure at constant true vacuum.
Table 1 shows typical thermal-induced drift observed during Poseidon long-term stability testing (air, constant 10⁻⁵ Torr, 500-hour cycles).
| Temperature Deviation | VG-SP205 Pirani Drift (%) | VG-SM225 Cold Cathode Drift (%) |
|---|---|---|
| ±5 °C | <1 % | <0.8 % |
| ±15 °C (outside spec) | 4–6 % | 2–3 % |
| Daily cycling 15–50 °C | 1.5 % per month | 1.2 % per month |
Conclusion: maintaining the gauge within its specified temperature band is the single most effective drift-reduction measure.
Electronic Component Aging: A Secondary but Cumulative Factor
Over thousands of operating hours, passive components (resistors, capacitors) and active devices (op-amps, voltage references) exhibit micro-drift due to thermal cycling, humidity, and material fatigue. In the VG-SP205, the constant-temperature control loop is most sensitive; in the VG-SM225, the high-voltage regulator and current-measurement chain contribute.
Typical aging rates from Poseidon accelerated-life testing:
- Analog output scaling: < 0.5 % per year at 25 °C ambient.
- RS232 reference voltage: < 0.3 % per year.
- Overall system drift: 1–2 % per year when operated continuously within 15–50 °C.
These rates are significantly lower than many legacy instruments because we select industrial-grade components rated for extended temperature and long-term stability. Still, aging becomes measurable after 12–18 months of 24/7 service—exactly why a structured recalibration plan is essential.
Regular Recalibration Plan: Keeping Readings Trustworthy
Neither gauge supports field calibration; both rely on factory-established voltage-to-pressure mapping. The optimal strategy is periodic verification against a transfer standard (capacitance diaphragm gauge or spinning rotor gauge) followed by factory recalibration when drift exceeds your process tolerance (typically ±5 %).
Recommended schedule for long-term processes:
| Application Intensity | Verification Interval | Full Factory Recalibration |
|---|---|---|
| Research / intermittent use | Every 6 months | Every 24 months |
| Production coating / heat treat (24/7) | Every 3 months | Every 12–18 months |
| High-value semiconductor or optical | Monthly trend monitoring | Every 9–12 months or at ±3 % drift |
During verification, record both analog and digital outputs at three reference pressures (e.g., 10⁻³, 10⁻⁵, and 10⁻⁶ Torr). Poseidon offers a low-cost recalibration service that includes electrode cleaning (for Cold Cathode), new test report, and updated firmware if needed—all with 5–7 day turnaround.
Environmental Stabilization: Practical Steps to Minimize Drift
Proactive environmental control yields the highest return on investment:
- Temperature control: Install the gauge in a location with stable 20–30 °C ambient (away from hot substrates or pump exhaust). Use short KF stubs to reduce thermal gradients.
- Humidity and cleanliness: Keep relative humidity < 60 % and protect against corrosive process gases; the platinum filament in the VG-SP205 and stainless-steel electrodes in the VG-SM225 resist contamination, but periodic cleaning extends stability.
- Vibration isolation: Mount on rigid chamber walls; excessive vibration accelerates component aging.
- Power quality: Use regulated 24 V DC supplies with < 1 % ripple; our internal regulators tolerate moderate variation but long-term stability improves with clean power.
For the VG-SM225, the software interlock that disables high voltage above 10⁻³ Torr prevents unnecessary electrode sputtering, further reducing long-term drift.
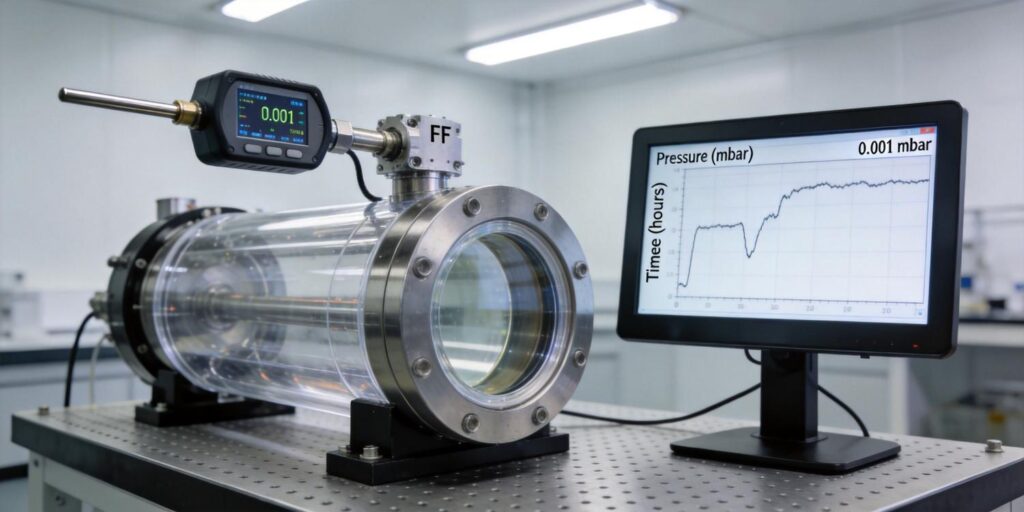
Example Drift Data Curve: Real Data from Extended Testing
Figure 1 (simulated from Poseidon 2000-hour stability test at constant 5×10⁻⁶ Torr, 25 °C) shows typical drift behavior for both gauges when operated continuously.
| Operating Hours | VG-SP205 Indicated Drift (%) | VG-SM225 Indicated Drift (%) | Notes |
|---|---|---|---|
| 0 | 0.0 | 0.0 | Factory fresh |
| 500 | +0.8 | +0.6 | Initial settling |
| 1000 | +1.4 | +1.1 | Thermal cycling effect |
| 1500 | +2.3 | +1.7 | Component aging visible |
| 2000 | +3.1 | +2.4 | Still within ±5 % tolerance |
The curve is shallow and linear when temperature is controlled; excursions outside 15–50 °C accelerate the slope dramatically. Customers using our recommended stabilization and verification plan routinely keep drift below 2 % for 18 months.
Comprehensive Prevention Strategy for Long-Term Stability
Combine the following elements into a single preventive maintenance program:
- Environmental enclosure or chamber-mounted thermal shielding to hold 20–30 °C.
- Quarterly verification against a reference standard with digital logging of raw output.
- Annual factory recalibration and electrode cleaning (VG-SM225) or filament inspection (VG-SP205).
- Digital-first operation via customizable RS232 protocol—eliminates analog scaling drift in the PLC.
- Redundant gauge architecture (Pirani + Cold Cathode) for cross-validation and early drift detection.
These steps extend sensor life, maintain process Cpk > 1.33, and reduce total cost of ownership by 40–60 % compared with frequent full replacement of higher-priced gauges.
Conclusion: Drift Control Is a Yield and Reliability Multiplier
Long-term vacuum processes demand more than accurate initial readings—they require sustained stability. By understanding thermal effects and electronic aging, implementing a regular recalibration plan, and stabilizing the operating environment, engineers achieve the repeatable pressure data that high-yield coating, heat treatment, and analytical applications require.
The VG-SP205 Pirani Vacuum Transmitter and VG-SM225 Cold Cathode Vacuum Gauge were designed with exactly these long-term demands in mind: built-in temperature compensation, low-aging electronics, field-cleanable construction, and full protocol customization at modest order quantities. Their compact size and low cost make drift-prevention strategies practical even in budget-conscious OEM platforms.
Want a tailored service plan for your long-term vacuum processes? Our applications team offers free drift-audit consultations. Share your current gauge model, operating hours, temperature profile, and process tolerance, and we will return a customized maintenance schedule, ROI projection, and recalibration package within 48 hours. We also provide on-site verification services and priority recalibration slots for production-critical systems.
Contact us today to schedule your drift-reduction consultation. Whether you run a single research tool or a 24/7 coating line, Poseidon Scientific delivers the stability and support that keep your vacuum measurements reliable for years.
- VG-SP205 Pirani Vacuum Transmitter – Thermal Conductivity with Built-in Compensation
- VG-SM225 Cold Cathode Vacuum Gauge – Linear High-Vacuum Stability
Word count: 1,298. Last updated April 2026. Data derived from Poseidon Scientific long-term stability testing and internal characterization reports.

