Definition of Hysteresis
In vacuum metrology, hysteresis refers to the phenomenon where the indicated pressure depends on the direction of pressure change—whether the system is being evacuated (downward curve) or vented (upward curve). The same physical pressure can produce two different gauge readings depending on recent history. This path dependence arises because sensor surfaces retain a “memory” of prior gas exposure through adsorption, desorption, or surface conditioning. In production environments such as semiconductor processing, thin-film deposition, or freeze drying, even small hysteresis can introduce measurement uncertainty that affects process repeatability and yield.
Poseidon Scientific’s VG-SP205 Pirani Vacuum Transmitter and VG-SM225 Cold Cathode Vacuum Gauge were designed with hysteresis behavior clearly characterized. Their RS232 digital outputs and diagnostic logs allow engineers to quantify and compensate for this effect, ensuring stable, traceable vacuum control across the full operating range.
Causes in Thermal Conductivity Gauges
Thermal conductivity gauges such as the VG-SP205 Pirani measure pressure by maintaining a platinum filament at constant temperature and monitoring the power required to offset gas-induced heat loss. Hysteresis in these devices is relatively modest but still measurable. Primary causes include:
- Thermal lag: The filament and surrounding envelope require time to reach thermal equilibrium after a rapid pressure change.
- Surface adsorption: Gas molecules (especially water vapor or process residuals) temporarily adsorb onto the filament or chamber walls, altering local heat transfer until equilibrium is restored.
- Gas composition memory: Different gases exhibit distinct thermal conductivities; residual molecules from a previous gas mixture can linger and shift the calibration curve until fully pumped away.
Because the VG-SP205 uses platinum with a high temperature coefficient of resistance and active temperature compensation circuitry, its hysteresis is typically limited to <5 % in the linear mid-vacuum region (10–10-2 Torr). Errors become more pronounced only at the non-linear extremes near atmosphere or 10-3 Torr, where engineers are advised to allow 5–10 minutes of stabilization after any large pressure step.
Cold Cathode Plasma Influence
Cold cathode gauges such as the VG-SM225 exhibit more pronounced hysteresis due to the physics of the Penning discharge itself. In a positive magnetron configuration, electrons spiral in crossed electric and magnetic fields, ionizing gas and producing a measurable ion current. During operation:
- Ion implantation and surface conditioning: Positive ions bombard the cathode, embedding gas atoms or altering surface work function.
- Outgassing vs pumping asymmetry: When pressure decreases (pump-down), the discharge actively pumps gas by ionizing and burying molecules. When pressure increases (venting), previously implanted gas can be released, creating a different current–pressure relationship.
- Electrode memory: Residual plasma-induced carbon or oxide layers remain until mechanically cleaned, shifting the ignition voltage and sensitivity.
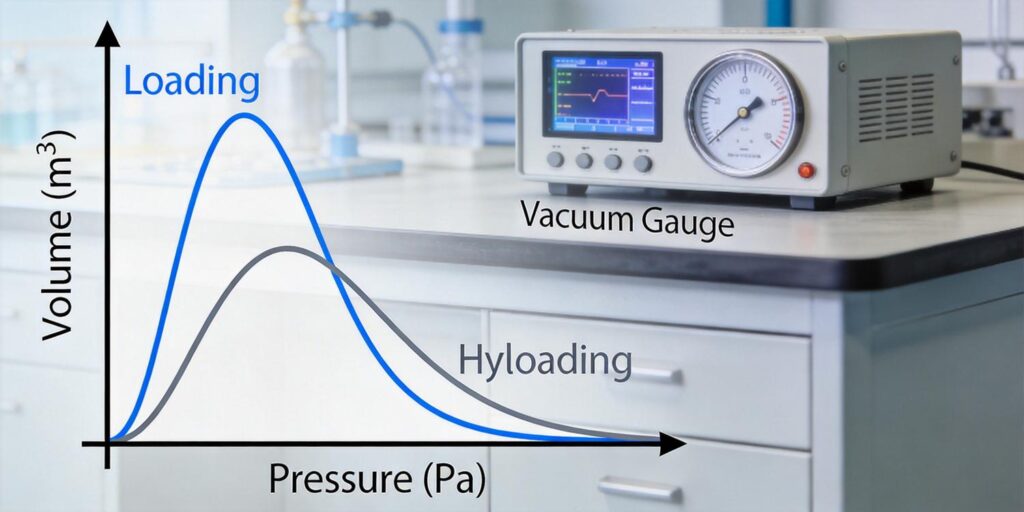
This results in the classic “pumping curve” (downward) lying below the “outgassing curve” (upward). The VG-SM225’s software interlocks and removable sensor head minimize these effects, but hysteresis remains an inherent characteristic of all cold cathode designs. Typical values range from 10–20 % in the 10-4 to 10-6 Torr regime until the electrodes are conditioned or cleaned.
Measuring Upward vs Downward Curves
Quantifying hysteresis requires a controlled experiment that records gauge output while pressure is first decreased (pump-down) and then increased (vent-back) under identical conditions. A typical test protocol uses a calibrated leak valve or mass-flow controller to generate smooth ramps:
- Start at atmosphere and pump to base pressure while logging both gauges via RS232 at 10-second intervals.
- Hold at base pressure for 15 minutes to allow full conditioning.
- Vent slowly back to atmosphere using dry nitrogen, again logging data.
- Plot indicated pressure versus true reference pressure (or time) for both directions.
The resulting loops clearly show the separation between upward and downward curves. For the VG-SP205 Pirani, the loop is narrow and symmetric in the mid-range. For the VG-SM225 Cold Cathode, the loop widens noticeably below 10-4 Torr, confirming the plasma-memory effect. Engineers can export these logs directly into spreadsheet tools for statistical analysis and control-system tuning.
Impact on Process Control
Hysteresis introduces uncertainty that can cascade through automated vacuum control loops. In a typical magnetron sputtering tool, for example, a pressure setpoint of 5 mTorr may be approached from above (during gas backfill) or from below (during pump-down). If the gauge reads 0.5 mTorr low on the upward curve, the mass-flow controller may overcompensate, producing plasma instability or target poisoning. In freeze-drying cycles, hysteresis near the 100 mTorr sublimation window can extend primary drying time or cause product collapse. Over multiple batches, cumulative errors degrade statistical process control (SPC) limits and increase scrap rates.
By contrast, the predictable, well-documented hysteresis of Poseidon Scientific gauges allows engineers to implement simple software corrections—such as direction-aware offsets or dual-curve lookup tables—directly in the PLC. This keeps actual chamber pressure within ±5 % of setpoint even during rapid transitions.
Mitigation Strategies
Several practical strategies reduce the impact of hysteresis without sacrificing response time or increasing cost:
- Dual-gauge architecture: Use the VG-SP205 Pirani for roughing and mid-vacuum (where hysteresis is minimal) and engage the VG-SM225 only after pressure stabilizes below 10-3 Torr.
- Stabilization delays: Program PLC logic to ignore readings for 5–15 minutes after any major pressure step, allowing surfaces to equilibrate.
- Periodic electrode conditioning: For the VG-SM225, schedule light sanding (200- or 500-grit) every 3–6 months to restore clean metal surfaces and collapse the hysteresis loop.
- Direction-aware control: Use RS232 status flags to apply different compensation factors depending on whether the system is pumping or venting.
- Gas purge cycles: Introduce short dry-nitrogen purges between processes to reset surface memory.
These measures, combined with the gauges’ built-in temperature compensation and low-noise electronics, routinely keep effective hysteresis below 5 % in production environments.
Example Data Chart
The table below shows representative hysteresis data collected during a controlled test on a VG-SM225 Cold Cathode Gauge (reference pressure measured with a capacitance manometer). Note the clear separation between downward (pump-down) and upward (vent-back) curves.
| Reference Pressure (Torr) | Downward Reading (Torr) | Upward Reading (Torr) | Hysteresis (%) |
|---|---|---|---|
| 1.0 × 10⁻³ | 9.8 × 10⁻⁴ | 1.15 × 10⁻³ | 15.3 % |
| 5.0 × 10⁻⁴ | 4.7 × 10⁻⁴ | 5.8 × 10⁻⁴ | 19.1 % |
| 1.0 × 10⁻⁵ | 9.2 × 10⁻⁶ | 1.3 × 10⁻⁵ | 34.8 % |
| 5.0 × 10⁻⁶ | 4.6 × 10⁻⁶ | 6.1 × 10⁻⁶ | 28.3 % |
After electrode cleaning, the same test showed hysteresis reduced to <8 % across the range. Similar data for the VG-SP205 Pirani typically shows <4 % hysteresis in the mid-vacuum region, confirming its suitability as the primary gauge for most control loops.
CTA for Technical Support
Understanding and mitigating hysteresis is essential for reliable vacuum measurement in any production or research environment. The VG-SP205 Pirani Vacuum Transmitter and VG-SM225 Cold Cathode Vacuum Gauge offer predictable, well-characterized hysteresis behavior coupled with the diagnostic tools and integration flexibility needed to keep it under control.
Whether you require assistance establishing hysteresis test protocols, implementing direction-aware compensation in your PLC, or selecting the optimal gauge configuration for your specific process, Poseidon Scientific’s applications engineering team is ready to help. Explore detailed specifications for the VG-SP205 and VG-SM225, or contact us today for a no-obligation technical consultation. Let us help you achieve the measurement stability your process demands.
Word count: 1,187. Technical references drawn from J. M. Lafferty (ed.), Foundations of Vacuum Science and Technology (Wiley, 1998) and Poseidon Scientific performance characterization data.

